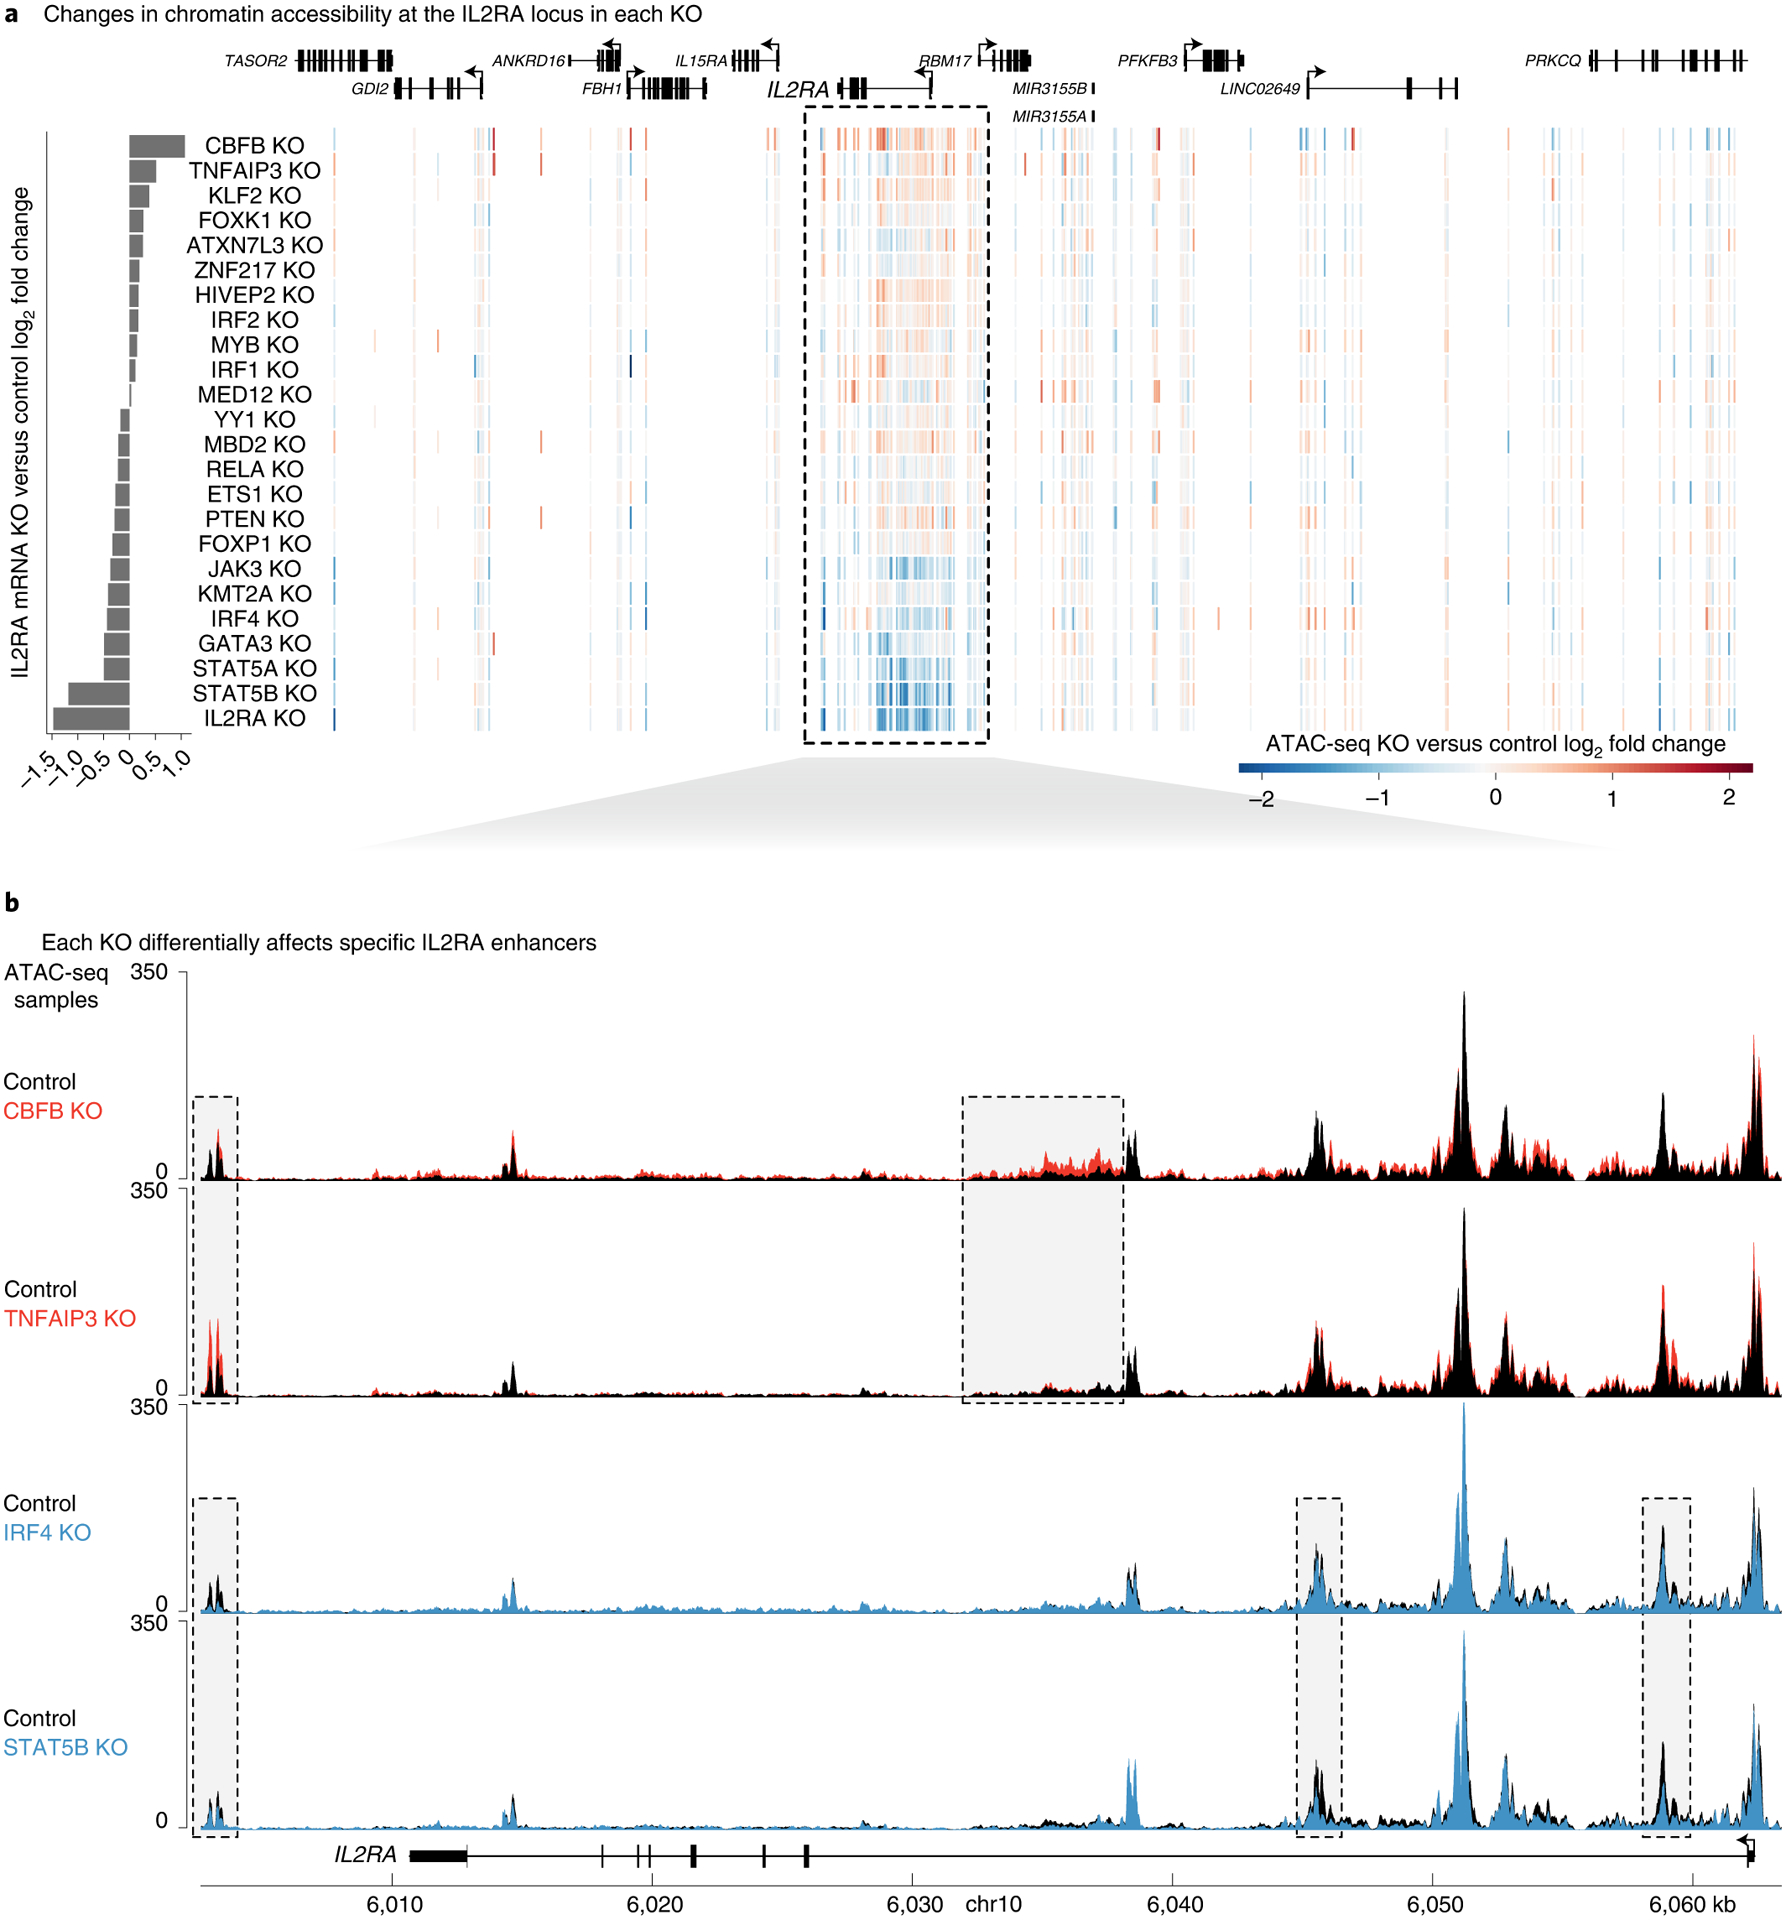
Fig. 4 |. Individual regulators act at distinct IL2RA CREs.

a, Heatmap of changes in chromatin accessibility around the IL2RA locus. Each row is a different knockout, and each vertical line is an ATAC-seq peak. Peaks with increased or decreased accessibility are shown in red or blue, respectively. Changes in IL2RA expression are shown at the left. b, Changes in chromatin accessibility at specific putative CREs throughout the IL2RA locus in CBFB, TNFAIP3, IRF4 and STAT5B knockouts. ATAC-seq data are shown as normalized read coverage; samples were normalized using the size factors from DESeq2. Examples of putative CRE dynamics that differ between the knockouts are boxed. n = 3 donors for RNA-seq and ATAC-seq. chr, chromosome. See also Extended Data Figs. 3 and 4.
