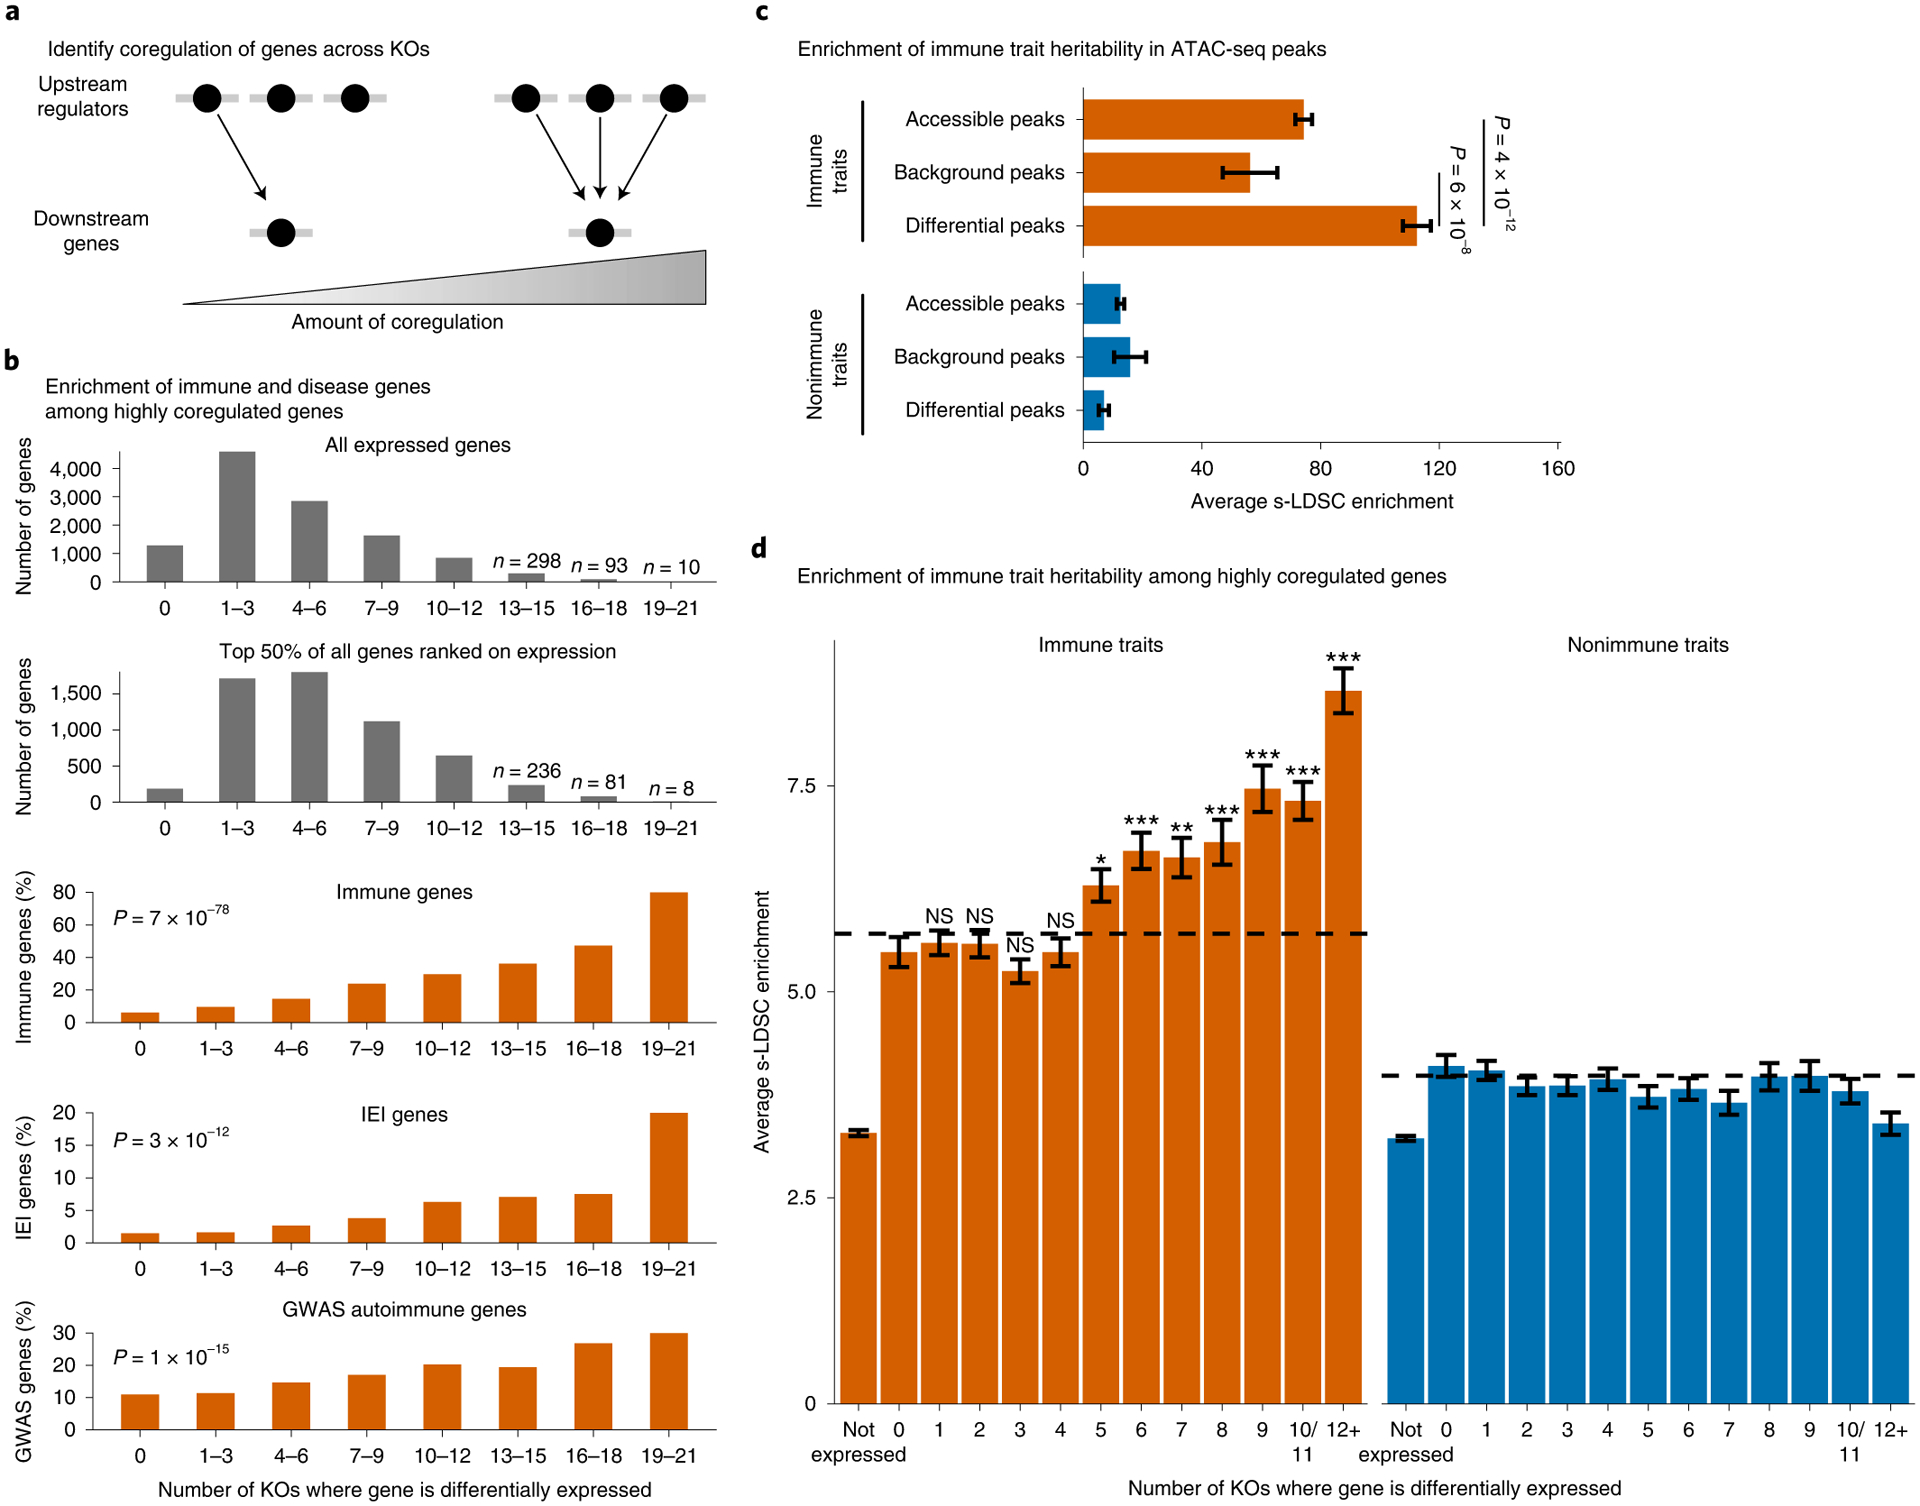
Fig. 6 |. Coregulated gene sets are enriched for immune disease genes.

a, Define the degree of gene coregulation based on the number of knockouts where a gene is differentially expressed. b, Total number of genes that are significantly differentially expressed in each knockout bin or the percent of differentially expressed genes that are classified as ‘immune system process’ genes by gene ontology, inborn errors of immunity (IEI) Mendelian disease genes, or autoimmune GWAS genes. (P values calculated with a logistic regression using average expression and coregulation bins as inputs. IL2RA, IL-2 and CTLA4 excluded from analysis.) c,d, Enrichment of heritability for immune traits compared with nonimmune traits in all ATAC-seq peaks or significantly differentially accessible ATAC-seq peaks (c) or in a 100-kb window around highly coregulated genes (d). Average background enrichment across coregulation bins is shown as dashed lines in d. Enrichment calculated using stratified LD score regression. Traits were meta-analyzed using inverse variance weighting; average enrichment and standard error shown. P values were calculated by first converting the difference in average enrichments to Z scores, and then converting Z scores to two-sided P values (Methods). For d, Bonferroni-corrected P values range from 3 × 10⁻² to 4 × 10⁻²¹ for bins 5–12 versus bin 0. NS, not significant. n = 16 immune traits and n = 15 nonimmune traits for c and d. See also Extended Data Fig. 5.
