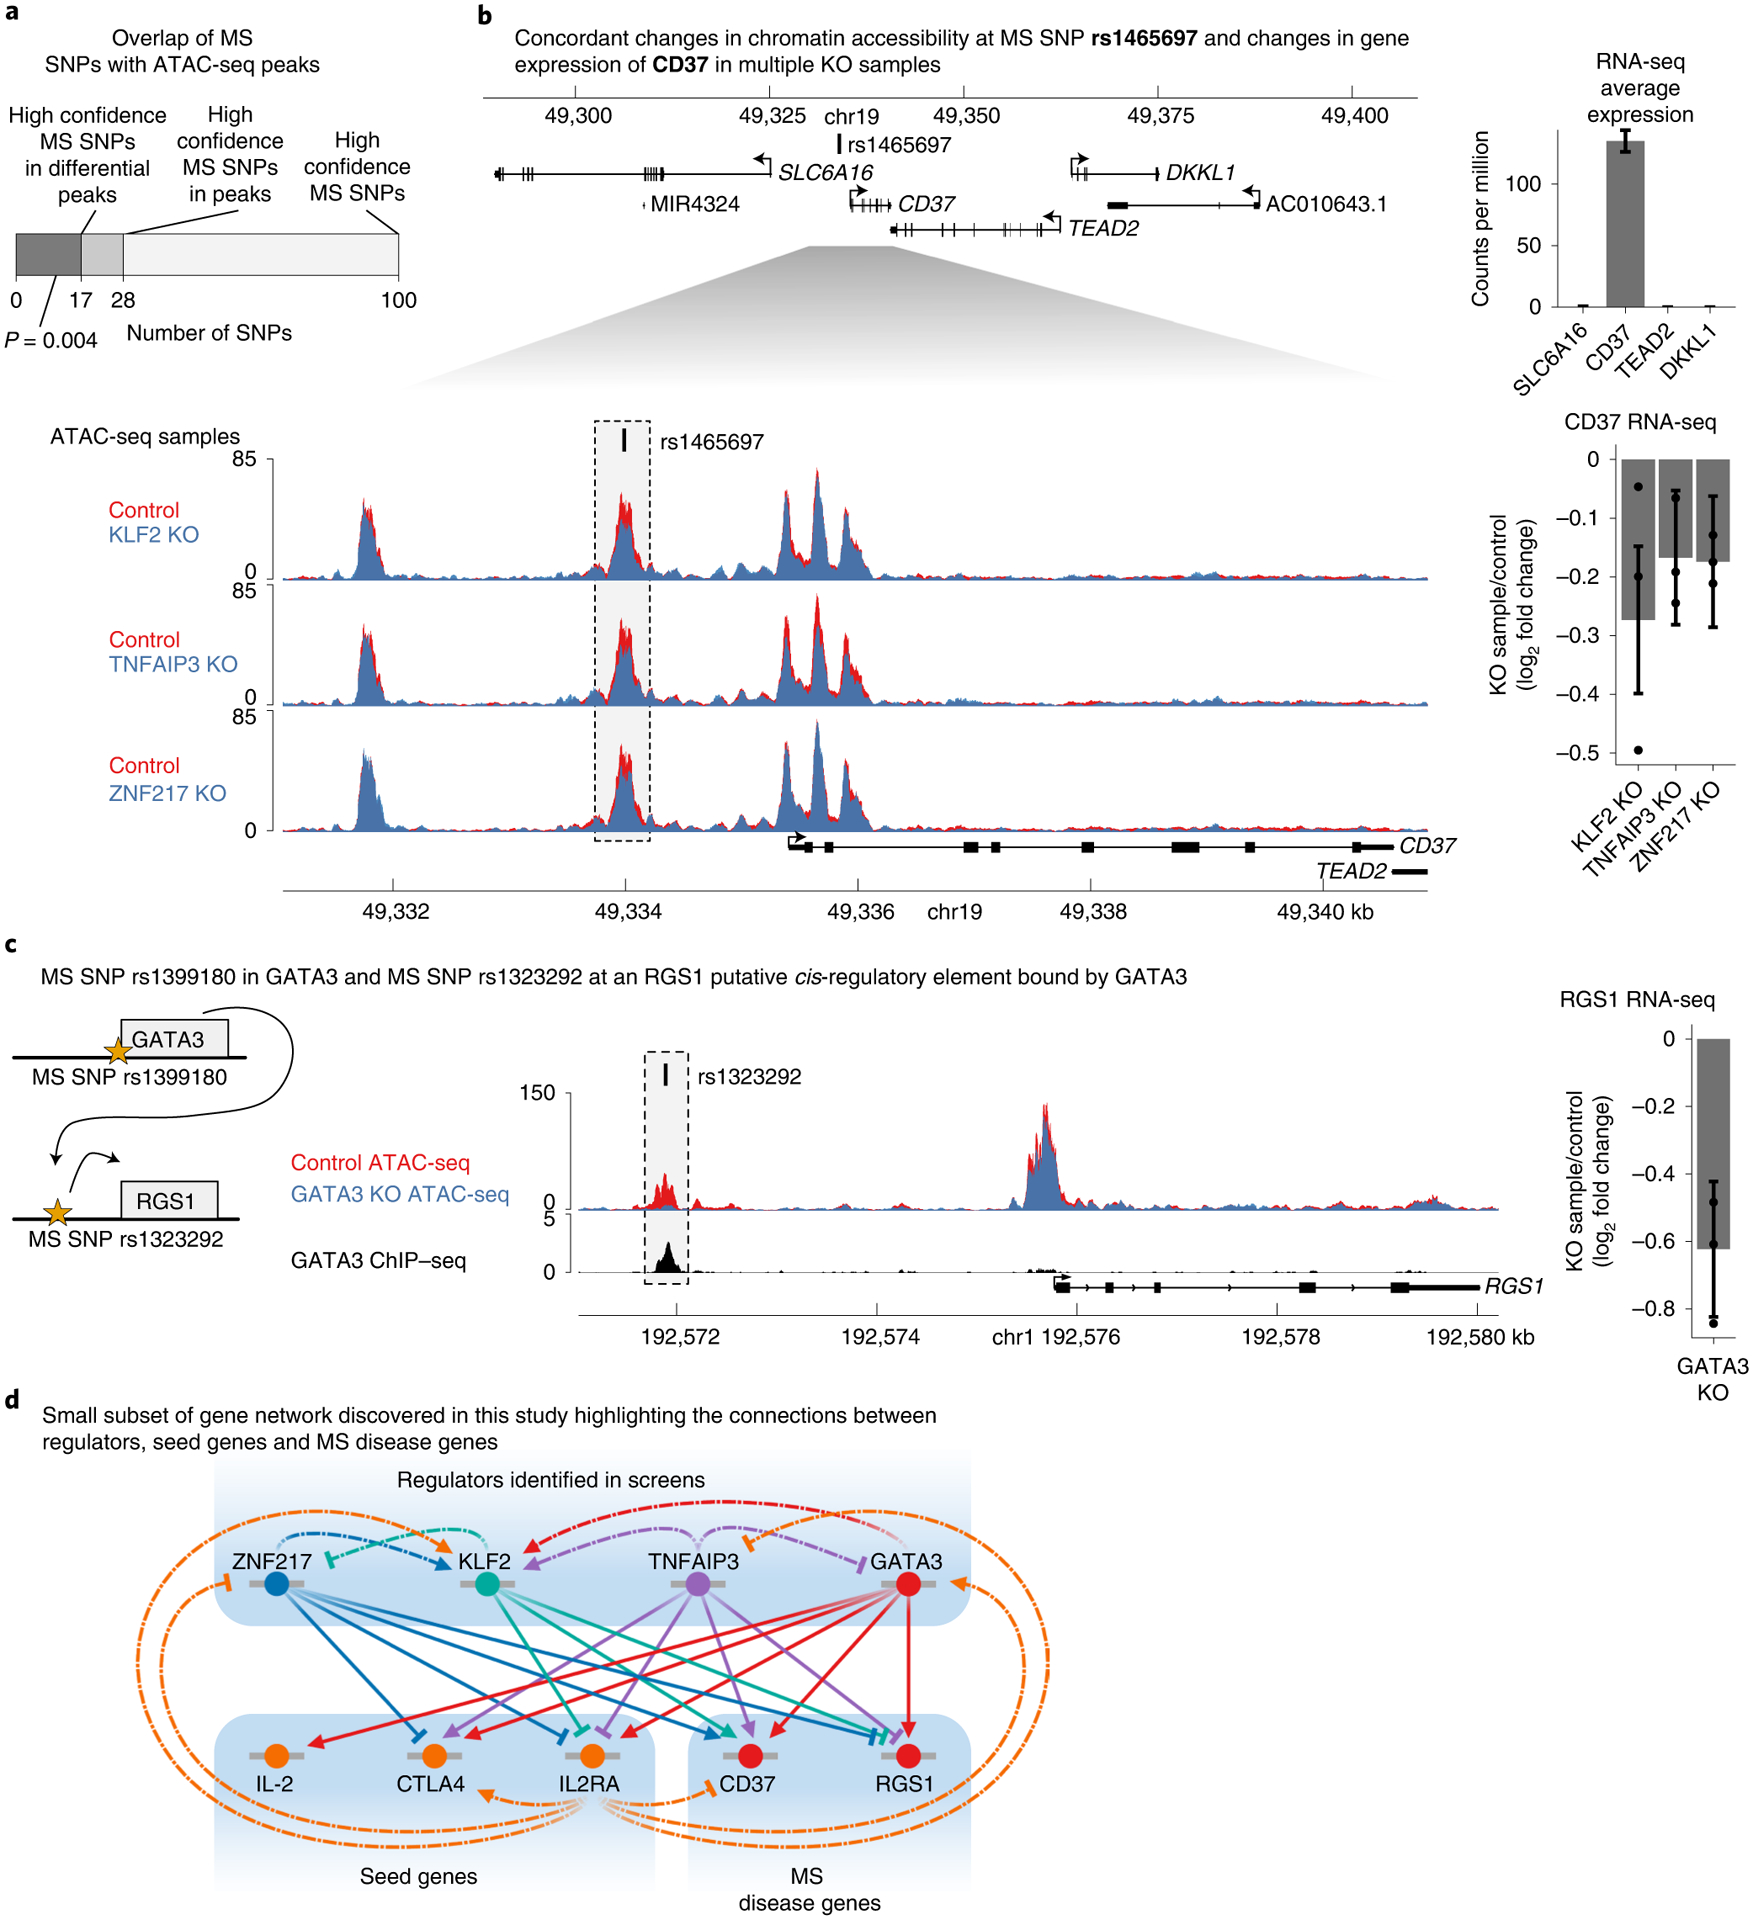
Fig. 7 |. IL2RA regulators affect CREs and genes associated with multiple sclerosis.

a, The number of high confidence MS SNPs with a PICS probability >0.5 in the genome, in all ATAC-seq peaks, or in differentially accessible ATAC-seq peaks (for which the P value was calculated with one-sided hypergeometric test). b, Top, expression of genes surrounding MS SNP rs1465697 in CD4+ T cells. Data are presented as mean ± s.d. Bottom, changes in chromatin accessibility at rs1465697 and accompanying changes in CD37 expression in KLF2, TNFAIP3 and ZNF217 knockouts. ATAC-seq data are shown as normalized read coverage; samples were normalized using the size factors from DESeq2. RNA-seq data are presented as the effect size from Limma with error bars showing the 95% confidence interval. c, Cartoon illustrating MS SNPs both at GATA3 and at a putative CRE upstream of RGS1. Changes in chromatin accessibility at rs1323292 and accompanying changes in RGS1 expression in GATA3 knockout. ChIP–seq of GATA3 binding at rs1323292. ATAC-seq data are shown as normalized read coverage; samples were normalized using the size factors from DESeq2. ChIP–seq data are shown as background subtracted binding in reads per million. RNA-seq data are presented as the effect size from Limma, with error bars showing the 95% confidence interval. chr, chromosome. d, A small subset of the regulatory connections identified in this study between seed immune disease genes, their upstream regulators and MS disease genes. This subnetwork is focused on regulators that have a significant effect on CD37 or RGS1 chromatin accessibility and gene expression. n = 3 donors for all RNA-seq and ATAC-seq data in b and c. See also Extended Data Fig. 6.
