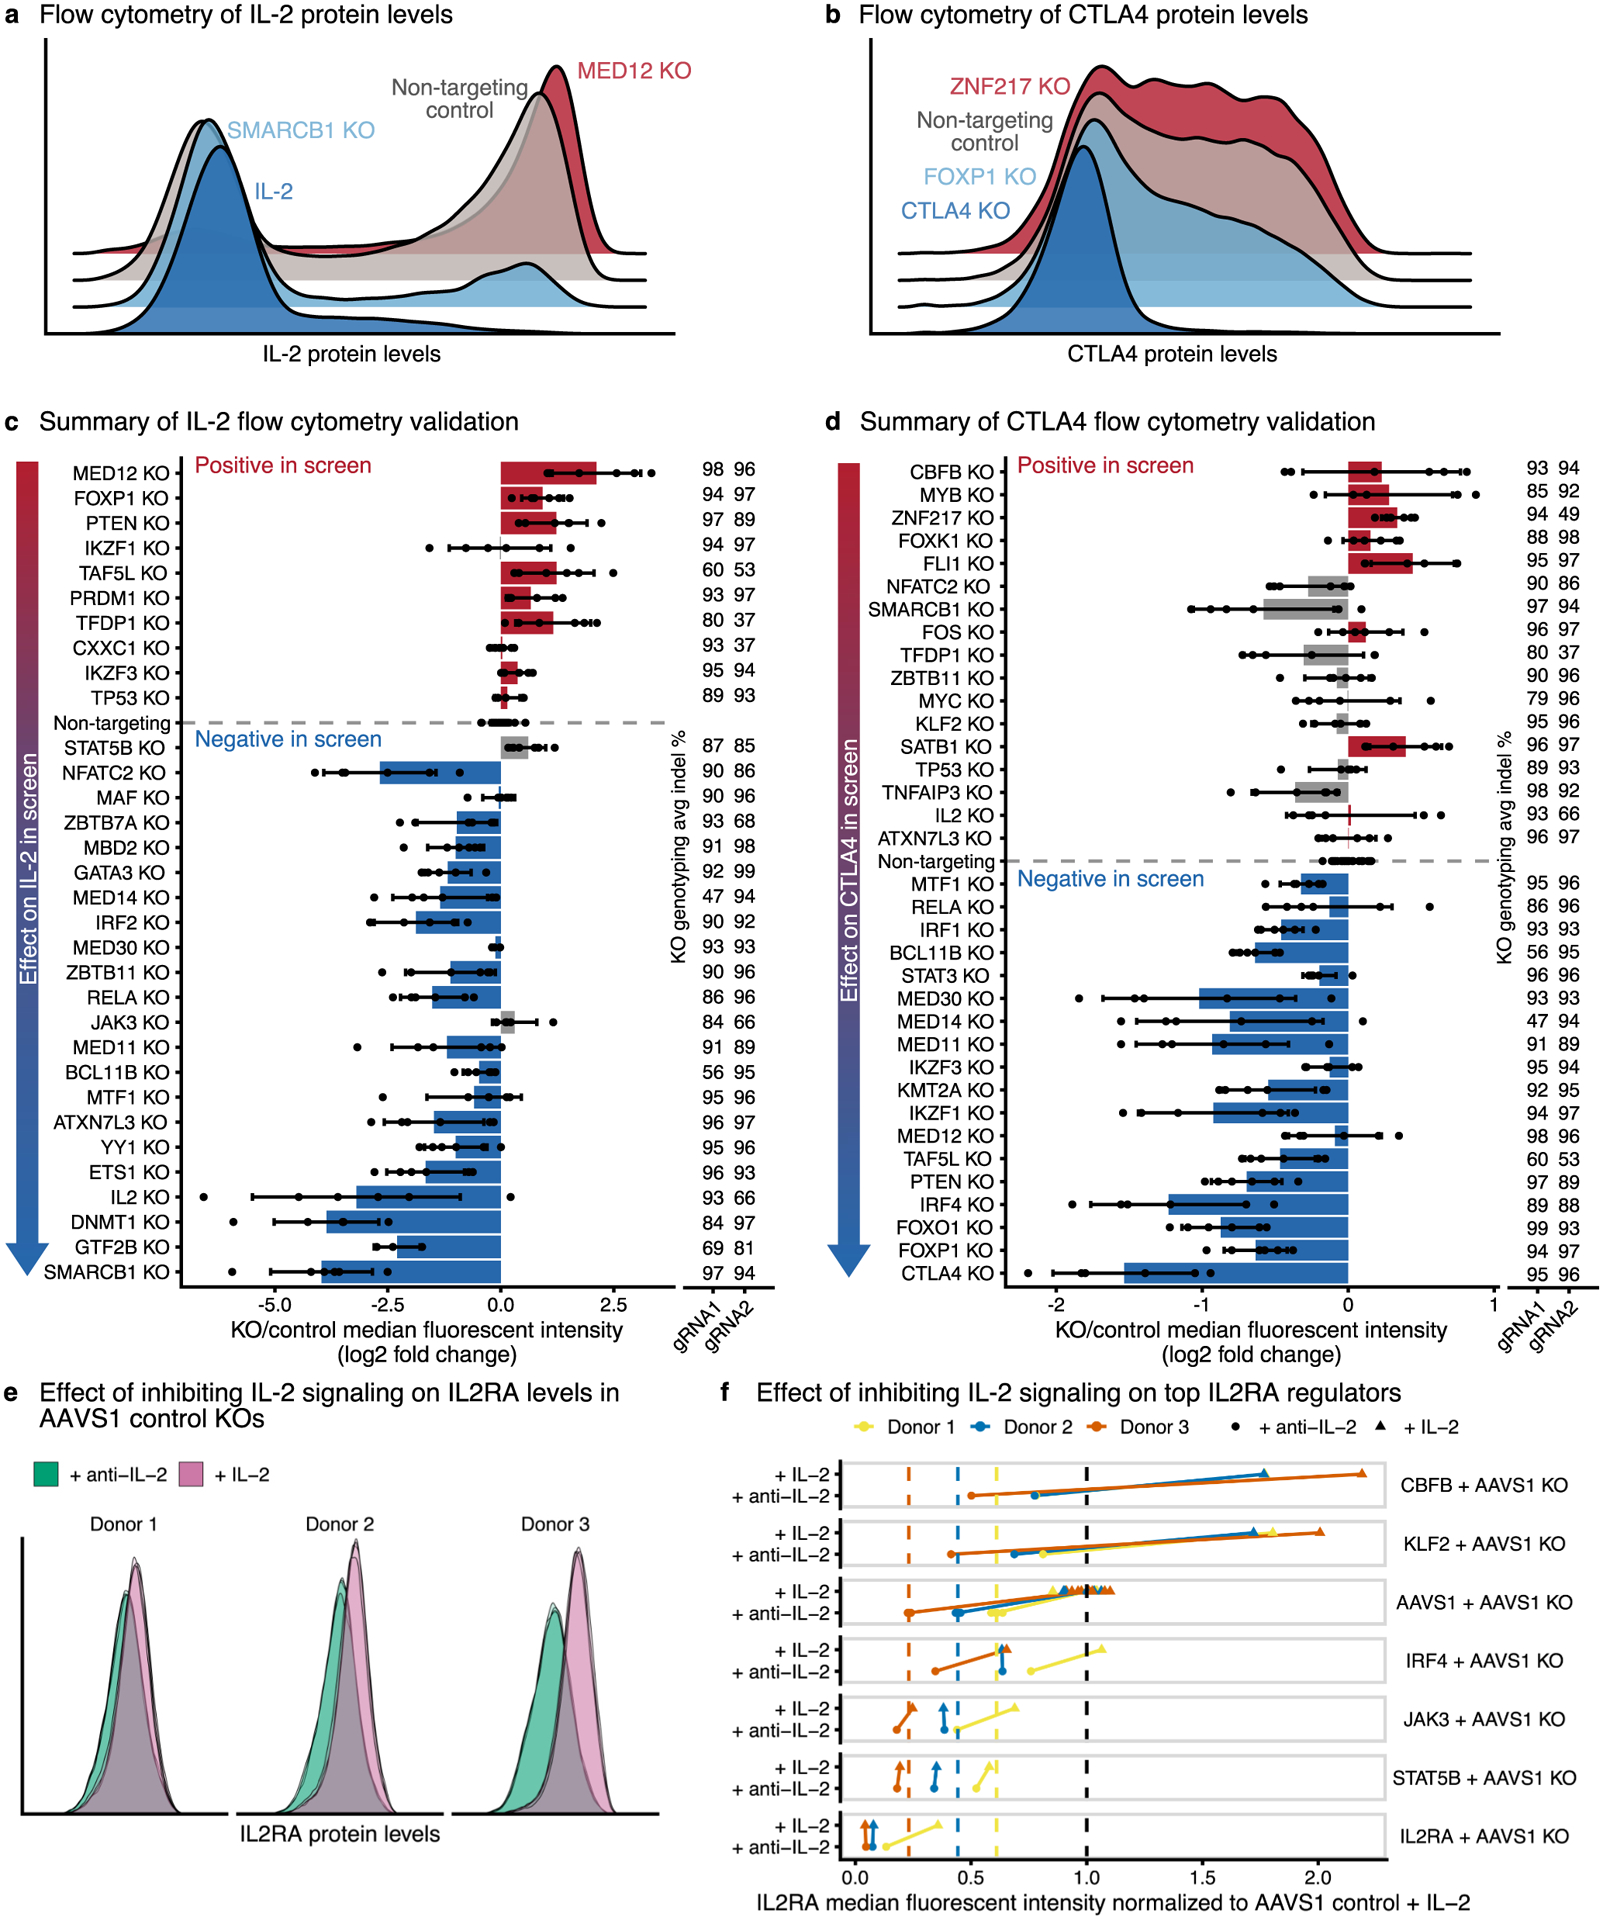
Extended Data Fig. 2 |. Arrayed knockouts validate IL-2 and CTLA4 screen results.

a,b, Representative flow cytometry density plots for IL-2 (a) or CTLA4 (b) protein levels after knockout of top screen hits. Knockout of hits that decrease target levels are shown in blue, and knockout of hits that increase target levels are shown in red. c,d, Summary of changes in IL-2 (c) or CTLA4 (d) levels measured using flow cytometry. Screen hits selected for validation are displayed on the y-axis ordered by their effect size in the pooled CRISPR screen. For each knockout, bars show the average change in IL-2 or CTLA4 median fluorescence intensity relative to non-targeting controls. Dots show individual data points, and error bars show standard deviation across two guide RNAs and three donors per guide RNA. Concordant changes between the screen and validation that increase or decrease IL-2/CTLA4 levels are shown in red or blue, respectively. Discordant changes are shown in grey. The average insertion/deletion (indel) percentage at the genomic target site across multiple donors for guide RNA 1 (n = 3) and guide RNA 2 (n = 2) is shown to the right. e, Representative flow cytometry density plots for IL2RA protein levels after cells are grown with exogenous IL-2 or without IL-2 + blocking anti-IL-2 antibody. f, Knockout of top regulators of IL2RA in cells cultured with exogenous IL-2 or without IL-2 + blocking anti-IL-2 antibody. IL2RA median fluorescent values are normalized to AAVS1 control knockouts with exogenous IL-2 (black dashed line). Colored dashed lines show the normalized IL2RA median fluorescent intensity averaged across the AAVS1 control knockouts without IL-2 + blocking anti-IL-2 antibody in each donor.
