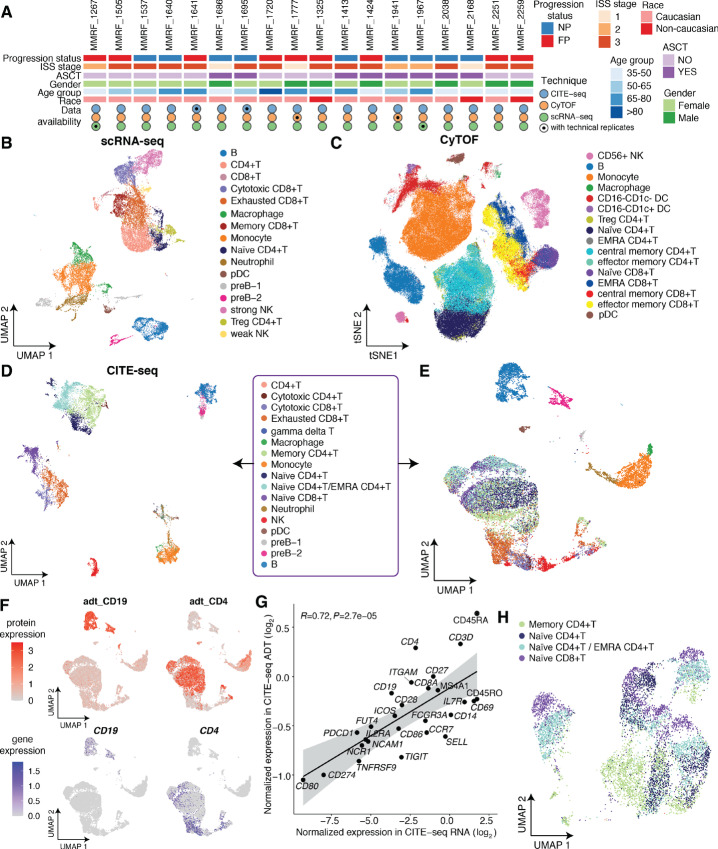
FIGURE 1.
Overview of cell populations of 18 multiple myeloma patient samples subject to scRNA-seq, CyTOF, and CITE-seq. A, Patient characteristics and single-cell data collection. FP and NP denote fast progressors and nonprogressors, respectively. ISS = International Staging System. ASCT = Autologous Stem Cell Transplantation. B, UMAP projection of integrated scRNA-seq data, with cells colored by immune cell types. C, t-SNE projection of integrated CyTOF data, with cells colored by immune cell types. D, UMAP projection of integrated CITE-seq data, with cells clustered by integrated RNA and ADT expression, colored by immune cell types. E, UMAP projection of integrated CITE-seq data, with cells clustered by transcriptional level alone, colored by immune cell identities from D. F, Comparison of canonical cell type marker gene expressions between protein level (ADT, top) and transcriptional level (RNA, bottom). Cells are colored by normalized expression. G, Concordance of sample-level average expressions of CITE-seq protein markers measured at RNA level and ADT level. The gray shaded area represents the 95% confidence interval around the line of best fit. R = Pearson correlation coefficient. H, UMAP projection of CD4+ T cells and naïve CD8+ T cells, which is the subset of integrated data in E, with cells clustered by transcriptional level alone, colored by immune cell identities from D and E.

