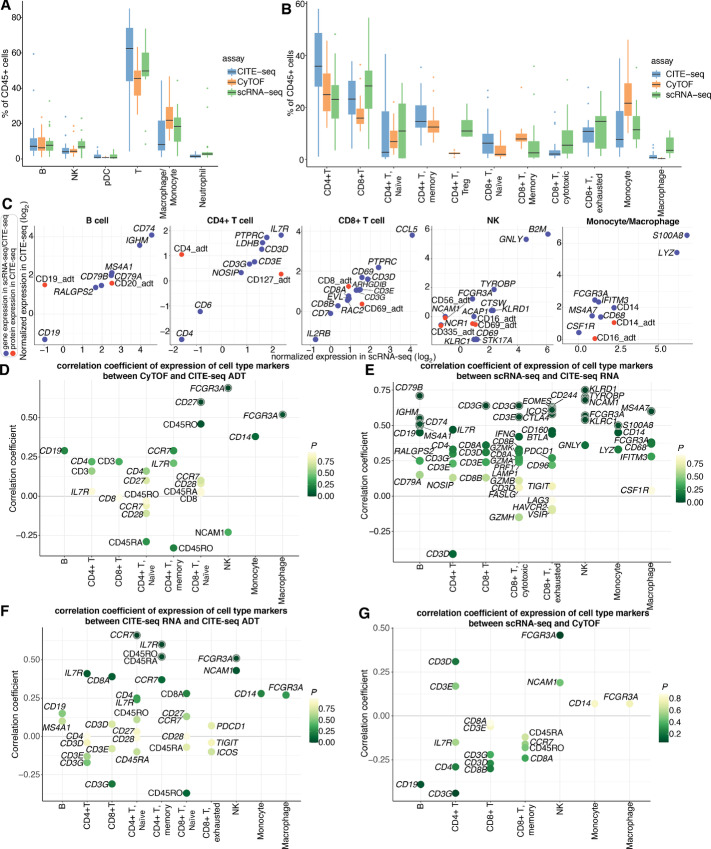
FIGURE 2.
Comparison of cell subset frequencies and correlations of expression of canonical cell type markers across different modalities. A, Main immune cell population (CD45+) frequencies observed by CITE-seq, CyTOF, and scRNA-seq. Each boxplot is colored by assay. CITE-seq populations are determined on the basis of integrated RNA and ADT expressions. B, Immune cell subtype frequencies for CITE-seq, CyTOF, and scRNA-seq. Each boxplot is colored by assay. CITE-seq populations are determined on the basis of integrated RNA and ADT expressions. C, Concordance of sample-level average expressions of canonical cell type markers in main cell subsets between scRNA-seq and CITE-seq. CITE-seq RNA and protein (ADT) level expressions are represented by blue and red dots, respectively. D, Spearman correlation coefficients of protein level expressions of cell type markers between CyTOF and CITE-seq. Each dot represents a marker gene and the color of the dot represents the P value of correlation. Markers are highlighted with an outer circle if the P value is less than 0.05. E, Spearman correlation coefficients of transcriptional level expressions of cell type markers between scRNA-seq and CITE-seq. Each dot represents a marker gene and the color of the dot represents the p value of correlation. Markers are highlighted with an outer circle if the P value is less than 0.05. F, Spearman correlation coefficients of cell type markers between transcriptional level and protein level expressions in CITE-seq. Each dot represents a marker gene and the color of the dot represents the P value of correlation. Markers are highlighted with an outer circle if the P value is less than 0.05. G, Spearman correlation coefficients of cell type markers between transcriptional level expressions from scRNA-seq and protein level expressions from CyTOF. Each dot represents a marker gene and the color of the dot represents the P value of correlation. Markers are highlighted with an outer circle if the P value is less than 0.05.

