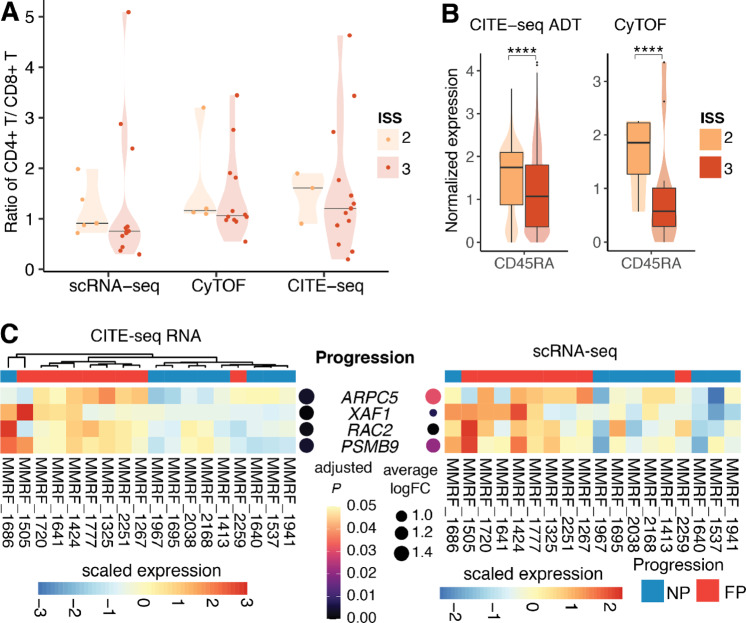
FIGURE 3.
Ratio of CD4+ T/CD8+ T of patients in different ISS stages and markers associated with ISS disease stages and multiple myeloma progression. A, Violin plots showing the ratio of CD4+ T/CD8+ T of patients in ISS stage 2 and 3 in scRNA-seq, CyTOF, and CITE-seq. Horizontal lines indicate the median of data points in each group. B, Violin plots showing single cell–level normalized expression of CD45RA in CITE-seq ADT measurement and CyTOF. The difference is significant at P ≤ 0.0001 based on Wilcoxon rank-sum test. C, Heatmaps showing DEGs of NK cells of FP versus NP patients in CITE-seq RNA measurement (left) and scRNA-seq measurement (right). The samples are ordered on the basis of hierarchical clustering of expression profiles of these genes in CITE-seq RNA measurement. Expression values are scaled such that for each gene, the average of the scaled expression is 0 and the SD is 1. Adjusted P values and log fold change in CITE-seq and scRNA-seq were shown on the left and right side of DEGs, respectively. FC = fold change.

