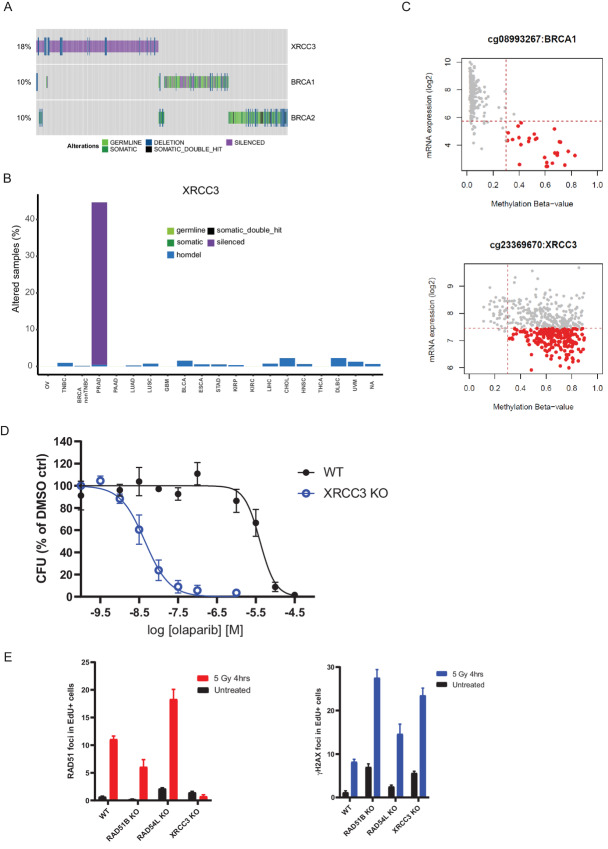
FIGURE 4.
XRCC3 gene silencing as potential biomarker of olaparib sensitivity in prostate cancer. A, Oncoprint depicting mutual exclusivity between LoF of XRCC3, BRCA1, and BRCA2 in the pan-cancer analysis. Each bar represents an individual tumor. Percentages indicate the number of altered samples in the whole dataset. B,XRCC3 biallelic inactivation is primarily driven by gene silencing in prostate cancer. Tumor types are the same as listed in Fig. 3. C, Correlation between BRCA1 (top) and XRCC3 (bottom) mRNA expression and promoter methylation scores. Highlighted in red are samples with high methylation scores and low mRNA expression values. D, Dose–response curves for DU145 isogenic XRCC3 KO cells treated with olaparib for 10–15 days in clonogenic assays. Results are shown as mean of n = 3 biological replicates ± SD. E, Quantification of RAD51 and γH2AX foci by immunofluorescence in DU145 isogenic pairs 4 hours after treatment with 5 Gy of ionizing radiation or in untreated cells. Results are shown as mean number of foci per nucleus in replicating (EdU-positive) cells (n = 3 biological replicates ± SD). Data for WT, RAD51B, and RAD54L KO are the same as shown in Fig. 2C.

