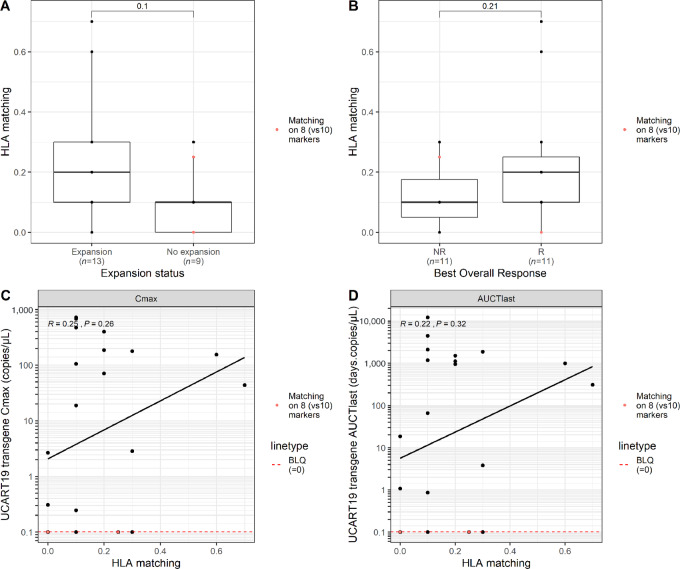
FIGURE 5.
Influence of HLA allele mismatching between unrelated UCART19 T-cell donors and recipients on UCART19 kinetics. Level of HLA matching (expressed as a percentage of overall matching) represented according to the UCART19 expansion status (A) or, clinical response status (B). Comparison is based on eight alleles (red dots) or 10 alleles (black dots) depending on local practices for HLA allele typing assessment. Relationship between HLA matching level and UCART19 Cmax (C) or, AUCTlast (D). Statistical comparison was performed using a Wilcoxon test for A and B and a Spearman correlation for C and D.

