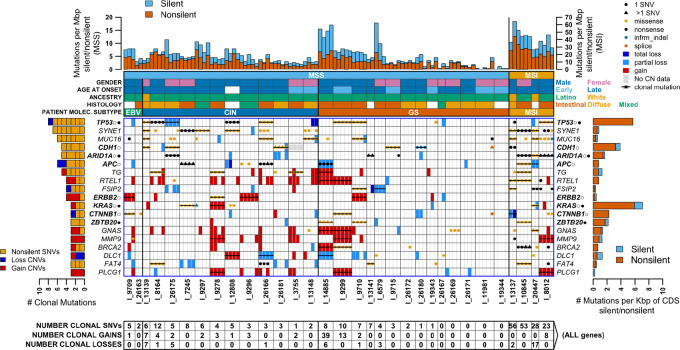
FIGURE 1.
Genes clonally mutated in 3 or more gastric cancer MSS/MSI patients. Gene names shown on both left and right sides are those where at least 3 patients have clonal somatic nonsilent single-nucleotide or short indel (SNV), or copy-number gain/loss (CNV) mutations. Patients (I_#### IDs) are separated by a dark vertical line and patient biopsies within them are separated by a lighter line. SNV and CNV mutations are shown for each gene/biopsy combination. Gains and losses are distinguished by box color, while SNVs are shown as a filled circle or triangle using color to distinguish the mutation type (key at top right; nonsense mutations include stop gain/loss and frameshift). A triangle rather than a circle means a gene has more than one mutation in a patient, and the type shown is the one generally most detrimental. A bar through all biopsies means the mutation is clonal. The left-side bar plot shows the total number of clonal mutations of each type in each gene, with short vertical lines separating individual patients. Numbers in boxes at the bottom give the total number of clonal mutations of each type in each patient in all genes (not just the ones shown). Patient molecular subtypes are indicated by color-coded bars just above the main figure area, and above those are additional color-coded bars indicating patient microsatellite instability status (MSS/MSI), sex, age of onset of gastric cancer (where late onset was defined as occurring at age >50), ancestry (Latino or White), and tumor histology. The top bar plot shows the SNV mutation rate in each biopsy, in the region targeted by the panel, with nonsilent and silent rates distinguished by color. MSS patients have a lower mutation rate and use the y-axis scale on the left, while MSI patients with a higher rate use the right-side scale. The right-side bar plot shows the SNV mutation count in each gene summed over all 115 biopsies, normalized by dividing by the gene CDS length in Kbp, with nonsilent and silent mutations distinguished by color. Gene names are in bold when they were found to be gastric cancer drivers by TCGA gastric cancer study, with open circles denoting driver genes in non-hypermutated (MSS) TCGA samples and filled circles denoting those in hypermutated (MSI) samples.

