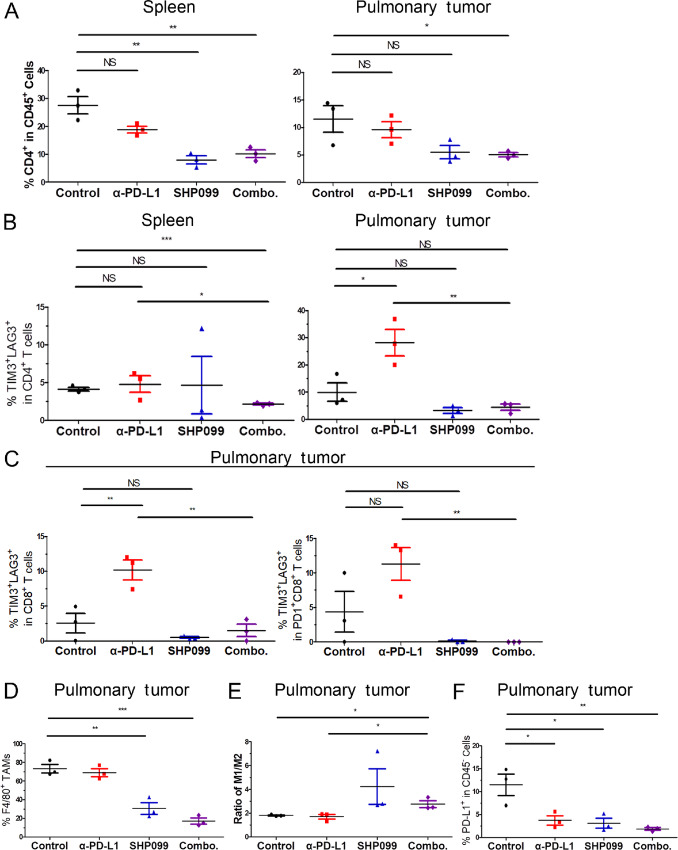
FIGURE 2.
Pharmacologic inhibition of SHP2 relieves T-cell exhaustion and reprograms the tumor–immune microenvironment. A, Quantification of CD4+ population as a frequency of CD45+ cells in isolated spleens (left) and lung tissues (right) of each group. B, Quantification of TIM3+LAG3+ population as a frequency of CD45+CD4+ cells in isolated spleens (left) and lung tissues (right) of each group. C, Quantification of TIM3+LAG3+ population as a frequency of CD45+CD8+ cells (left) and CD45+CD8+PD-1+ cells (right) of in isolated lung tissues of each group. D, Quantification of F4/80+ population as a frequency of CD45+CD11b+ cells in isolated lung tissues of each group. E, Plots comparing the ratio of CD86+ and CD206+ in F4/80+ population as M1/M2 in isolated lung tissues of each group. F, Quantification of PD-L1+ population as a frequency of CD45− cells in isolated lung tissues of each group. In all panels. *, P < 0.05; **, P < 0.01; ***, P < 0.001; n = 3.

