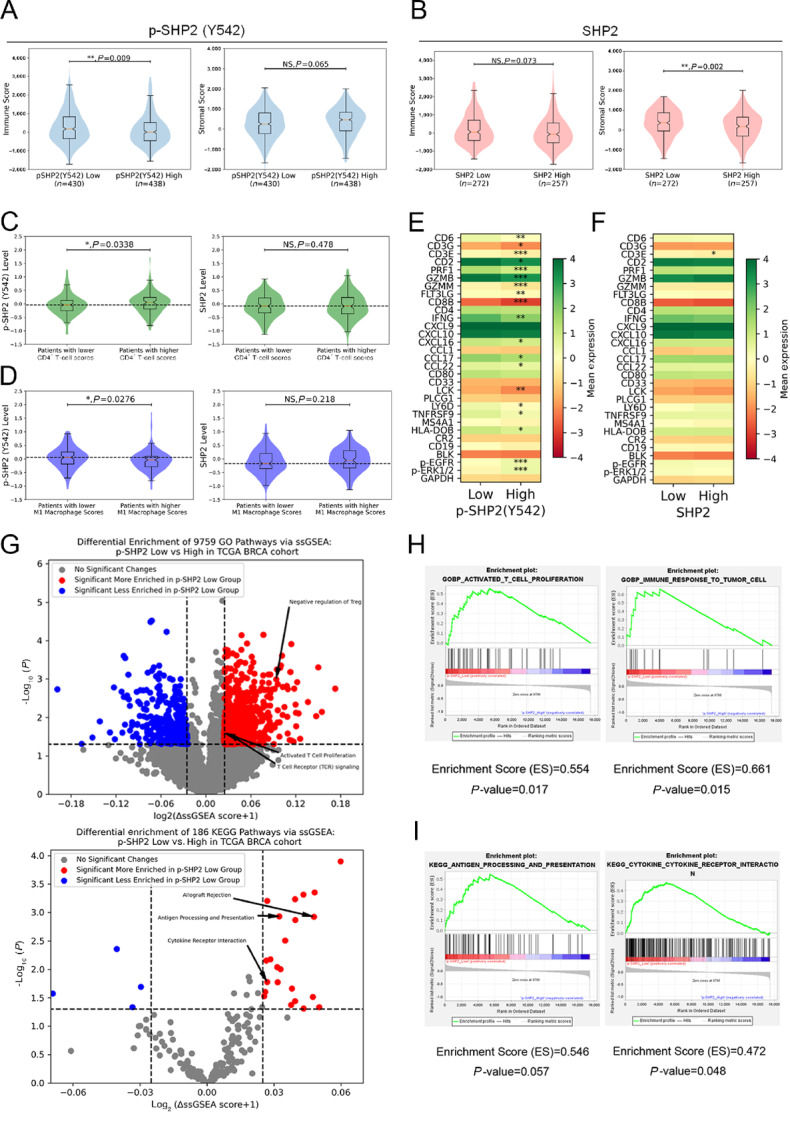
FIGURE 5.

Phosphorylation of SHP2 predicts immune profiles in patients with MBC. A, B, Violin and box plots comparing the differential immune scores and stroma scores in patients grouped by phosphorylation levels of SHP2 at Y542 (A) or expression levels of SHP2 (B). C, D, Violin and box plots comparing the differential phosphorylation levels of SHP2 at Y542 and expression levels of SHP2 in patients grouped by CD4+ T-cell infiltration (C) and M1 Macrophage infiltration (D) levels. Heatmaps comparing the differential gene expression in patients grouped by phosphorylation levels of SHP2 at Y542 (E) or expression levels of SHP2 (F). *, P < 0.05; **, P < 0.01; ***, P < 0.001. G, Volcano plots demonstrating pathways of differential ssGSEA scores in patients grouped by phosphorylation levels of SHP2 at Y542 with statistical significance. Specific pathways of interest are annotated. GSEA plots, Enrichment scores and P values of the key pathways from GO (H) and KEGG (I) enriched in patients with lower phosphorylation levels of SHP2 at Y542.
