
FIGURE 4.
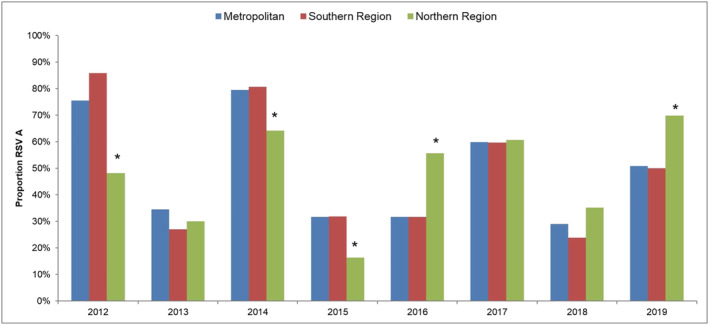
Proportion of RSV A cases compared with RSV B in each region by year. * denotes proportion was significantly different (p < 0.05) to the other regions for that year.
Official websites use .gov
A
.gov website belongs to an official
government organization in the United States.
Secure .gov websites use HTTPS
A lock (
) or https:// means you've safely
connected to the .gov website. Share sensitive
information only on official, secure websites.
Proportion of RSV A cases compared with RSV B in each region by year. * denotes proportion was significantly different (p < 0.05) to the other regions for that year.