. 2023 Feb 14;15(12):5712–5719. doi: 10.1039/d2nr06345j

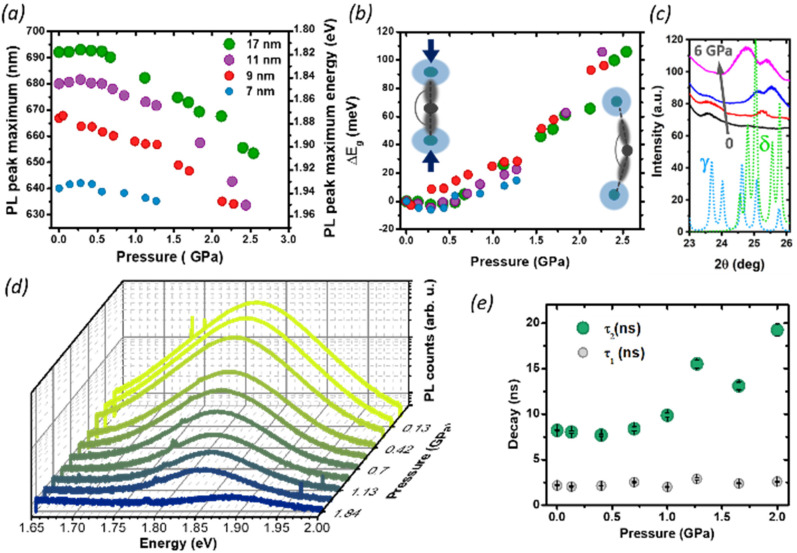
Fig. 4. PL pressure response of CsPbI3 NCs of different sizes: (a) the PL peak shift of CsPbI3 NCs with sizes of 7, 9, 11, 17 nm. (b) Shift of the PL energy with pressure. Insets: schematic representation of the deformation mechanisms of Pb–I bonds. When the pressure initially increases, the Pb–I bonds start to shorten, which increases the orbital overlap and results in band-gap narrowing and red shift of the PL. Beyond 0.35 GPa, a further increase in the pressure starts to tilt the octahedra, decreasing the Pb–I–Pb angle (<180°) and decreasing the overlap of the electronic wave functions of Pb and I, causing an increase in the band-gap and the PL blue shift. (c) Pressure dependent XRD. The continuous lines show the experimental data at 0 GPa (black), 0.13 GPa (red), 1.85 GPa (blue), 6.14 GPa (magenta). The dotted lines show the calculated diffraction pattern for the CsPbI3 γ-phase (light blue) and the δ-phase (green). With increasing pressure, the peak at 23.7° (belonging to the γ-phase) gradually disappears, while two new peaks at 25.1° and 25.6° appear indicating the formation a new formed δ-phase. (d) Representative pressure-dependent PL emission spectra of 11 nm NCs, showing gradual quenching of the PL intensity with pressure. (e) Time-resolved photoluminescence results: evolution of PL kinetics as a function of pressure, for 9 nm NCs. Exponential data are fitted with bi-exponential eqn (2) extracting fast and slow decay time.

Fig. 4