
Fig. 1.
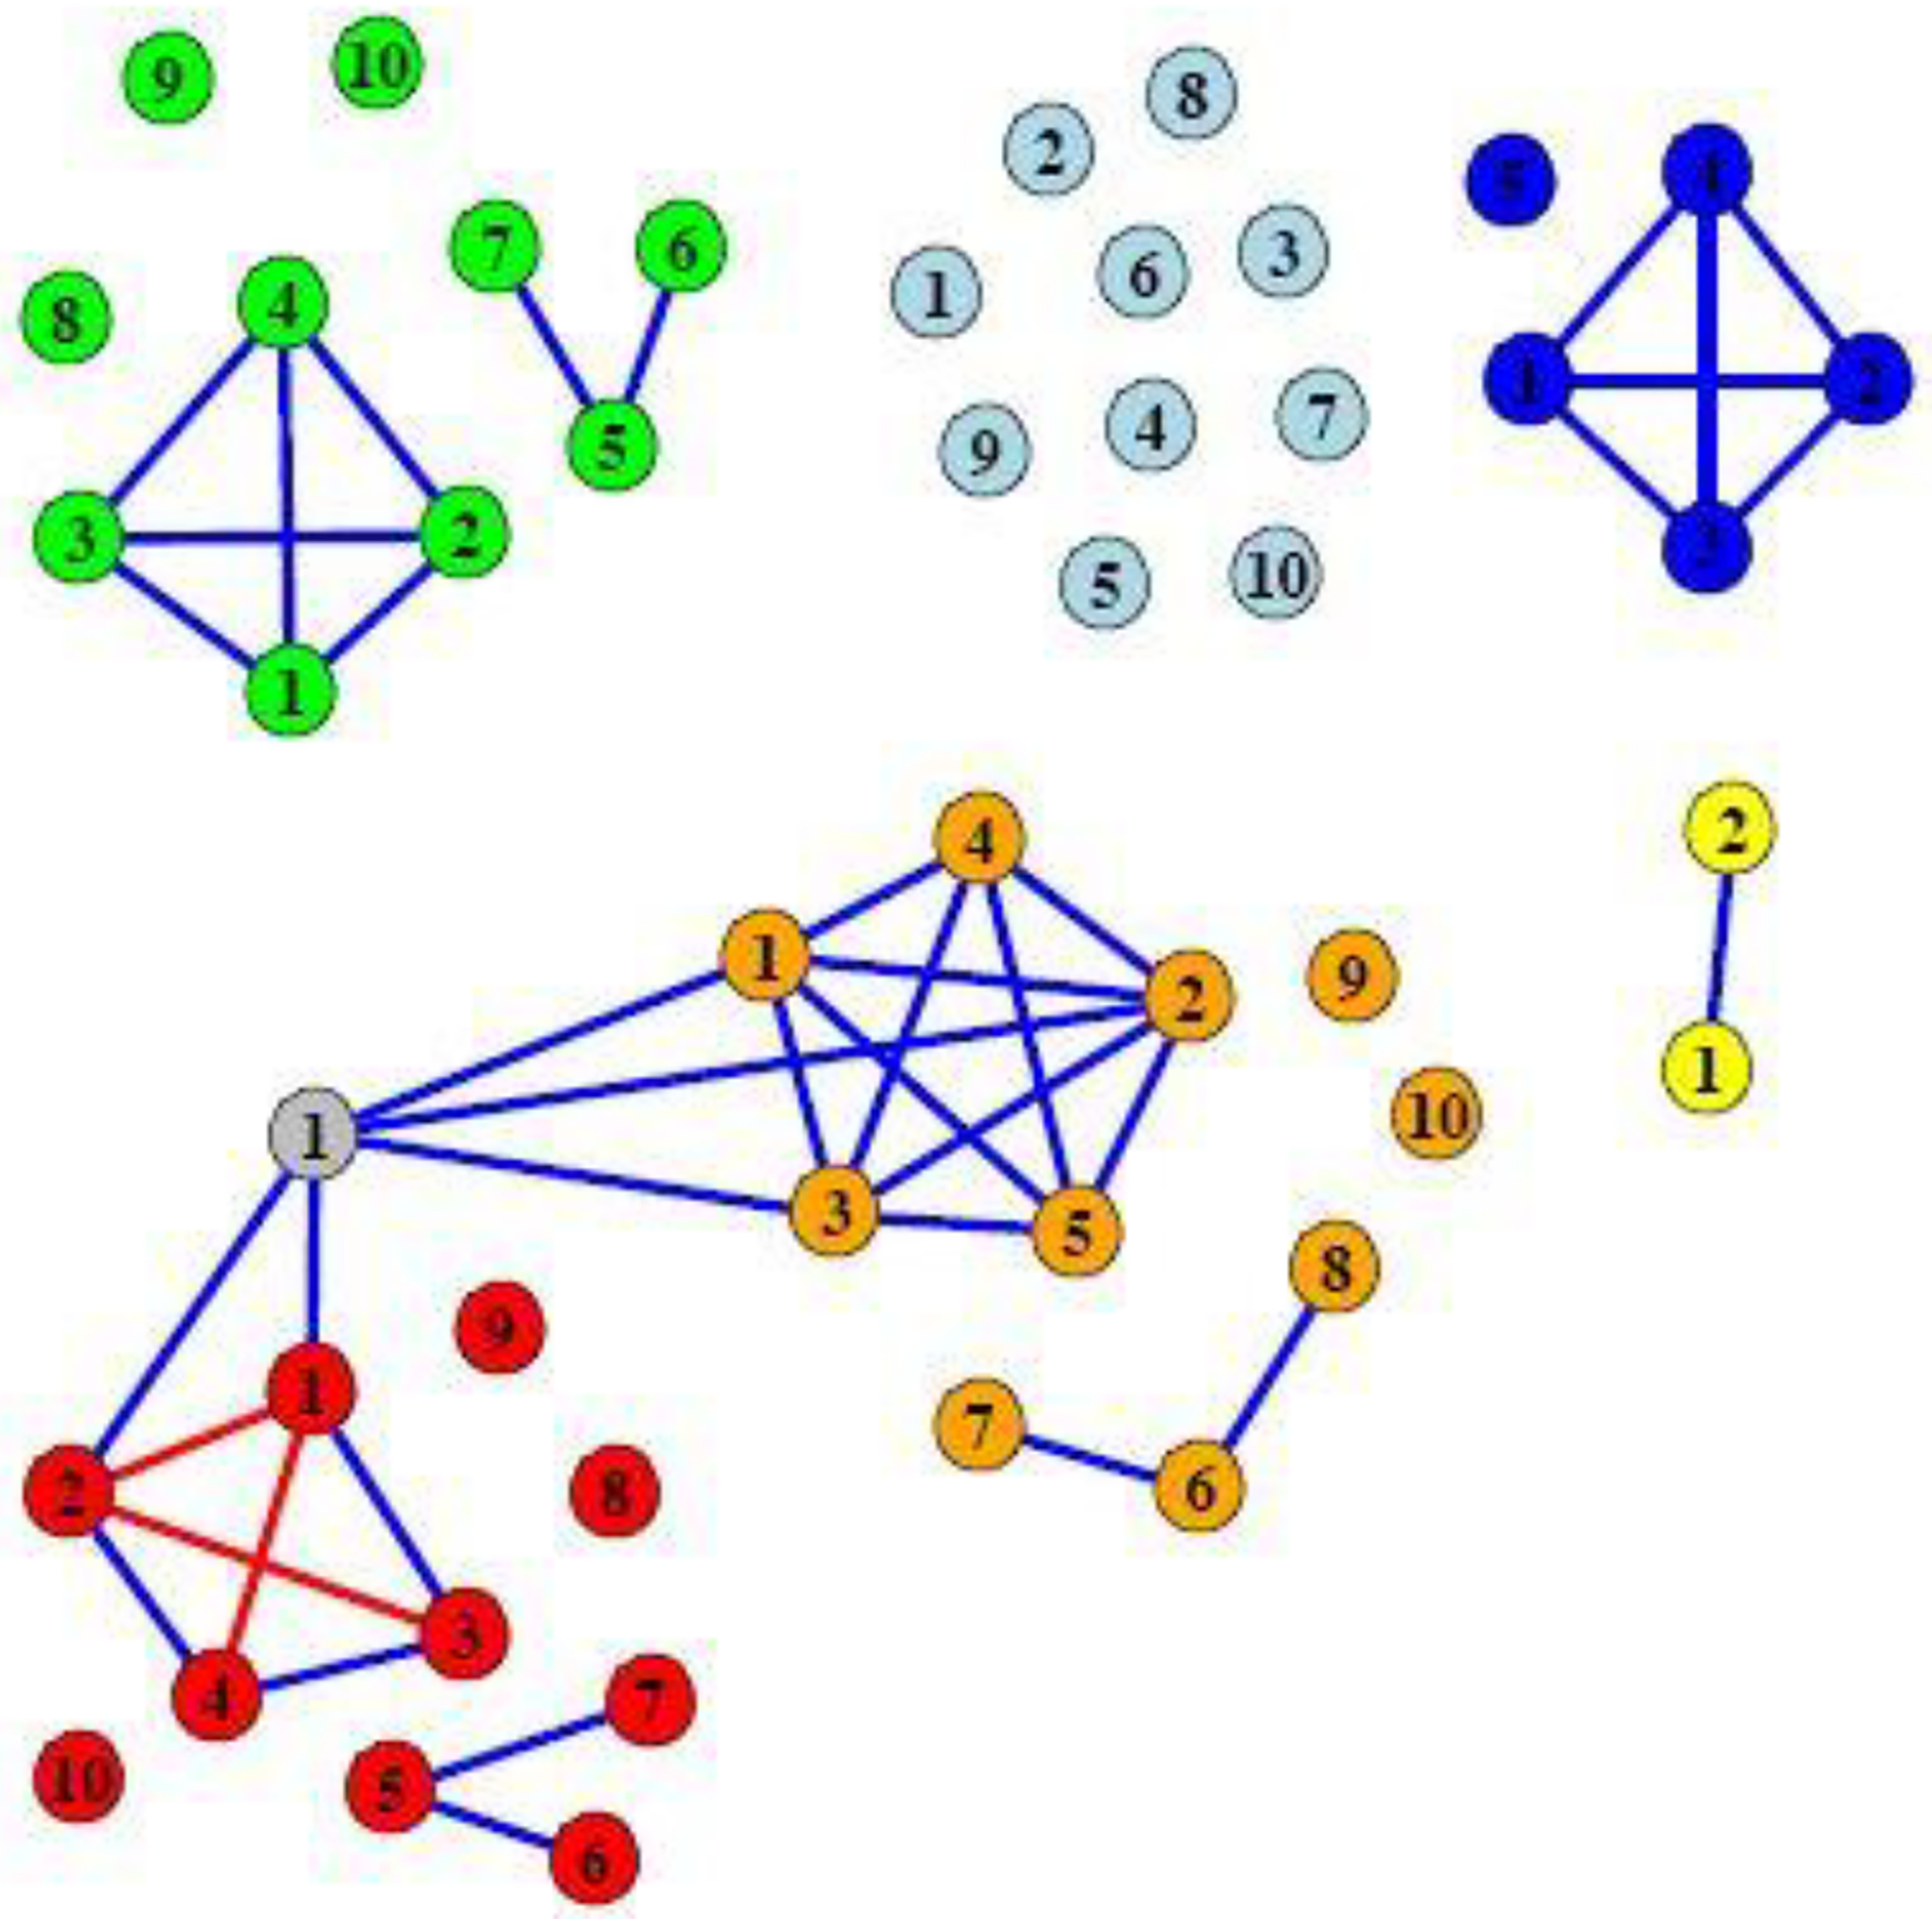
A representation of the covariance matrix Σ of the continuous predictors in the simulations. Each node represents one predictor. An edge between two predictors indicates that the covariance between the two predictors is 0.3. If there is no edge between two predictors, the pair is independent. The diagonal elements of Σ are 1. The node color indicates data domain membership. Orange: Data domain 1; Red: Data domain 2; Light blue: Data domain 3; Green: Data domain 4; Blue: Data domain 5; Yellow: Data domain 6; Grey: Data domain 7.