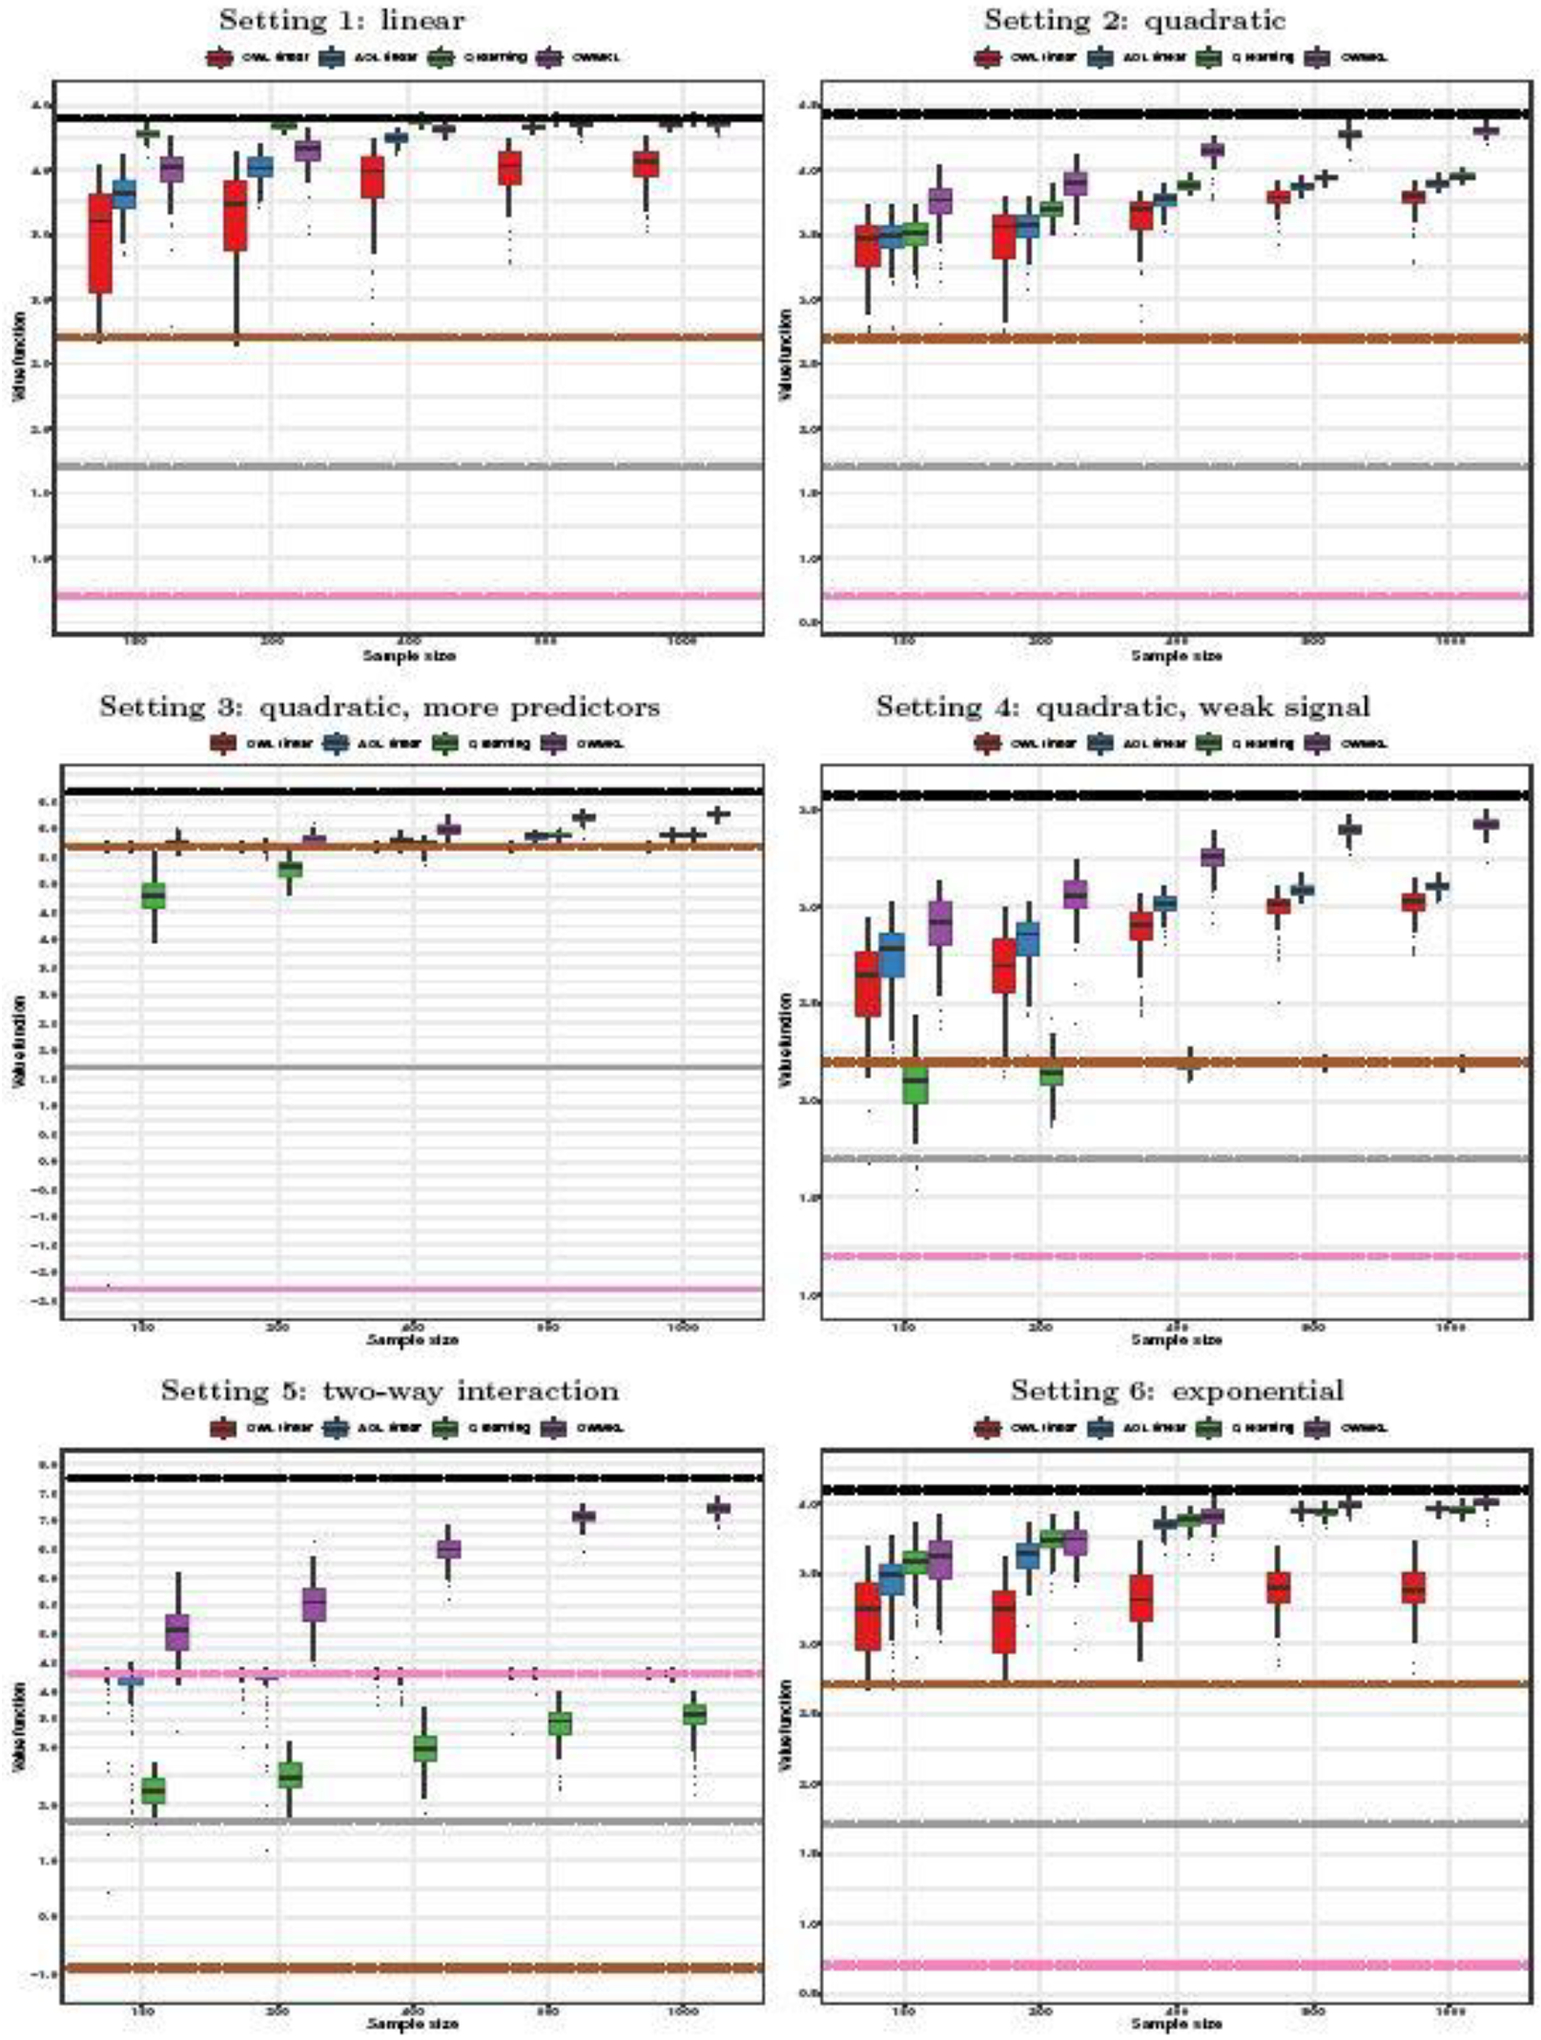
Fig. 2.

Boxplots of empirical value function in simulations. Black lines: true optimal bound; Grey lines: coin toss; Brown lines: all treatment 1; Pink lines: all treatment −1; Solid line: median of value function across simulations; Upper dash line: 75% quantile of value function across simulations; Lower dash line: 25% quantile of value function across simulations.
