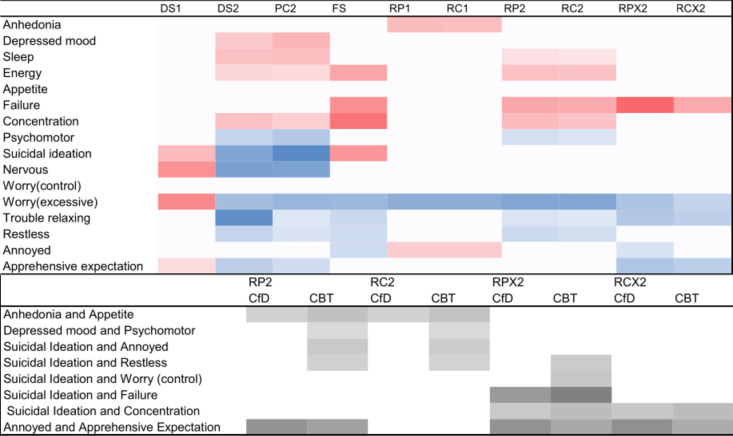
Figure 2.
(Top) Heat map of direct associations for each model. The heatmap displays the direct associations between symptoms and intervention type obtained using the different methods of calculating change and against different baseline timepoints. Colour scale: darker=stronger, with blue reflecting direct associations with CBT and red reflecting direct association with CfD. In the headings, the number refers to the baseline used (ie, session 1 or 2), DS, Difference Score; FS, Final Score only; PC, Proportional Change; RP, Residual Score (post score–baseline); RC, Residual Score (change score–baseline); X, propensity score–matched samples. (bottom) The influence of the type of intervention on symptom-to-symptom interactions. The values represent the presence and strength of the influence for the associations that differentiate the interventions. Colour scale: darker=stronger. CBT, cognitive–behavioural therapy; CfD, counselling for depression.

