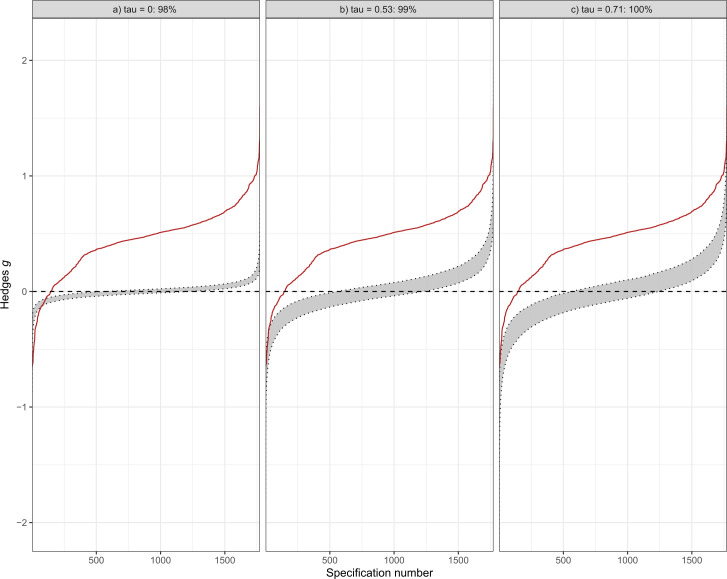
Figure 3.
Inferential specification curve. Depicted are three inferential specification curves (red lines), each summarising the magnitude-sorted meta-analytic summary effects and correspond to the descriptive specification curve from figure 2 (for computational reasons only the REML, FE and PET-PEESE models were used). The grey area represents the corresponding 97.5% and 2.5% quantiles of 1000 specification curves that were simulated assuming no true effect. The left panel depicts a fixed-effect scenario of no heterogeneity (τ=0), the middle panel a scenario of heterogeneity equal to the random-effects model (τ=0.53) and the right panel the scenario of the upper 95% CI estimate of τ from the random-effects model (τ=0.71). Each is simulated under the null hypothesis for a given specification number using a parametric bootstrap procedure, but they differ in underlying heterogeneity assumptions. If the specification curve exceeds the limits of the 95% CI (as is the case in this plot), there is evidence against the null hypothesis (g=0), indicating that there is a substantial effect for the effectiveness of psychotherapies for depression. FE, fixed effect; PET-PEESE, precision-effect test and precision-effect estimate with SE; REM, random-effects model.

