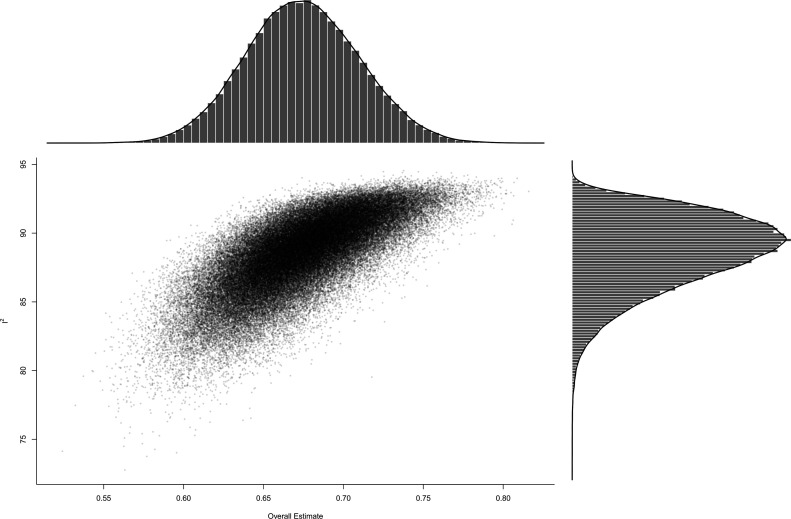
Figure 4.
GOSH (Graphical Display of Study Heterogeneity) plot. This GOSH plot visualises the heterogeneity of a random sample of 100 000 subsets for the combinatorial meta-analysis. The y-axis depicts Higgins I 2 statistics for heterogeneity, and the summary effect size is visualised on the x-axis. Density distributions are visualised next to the respective axes.

