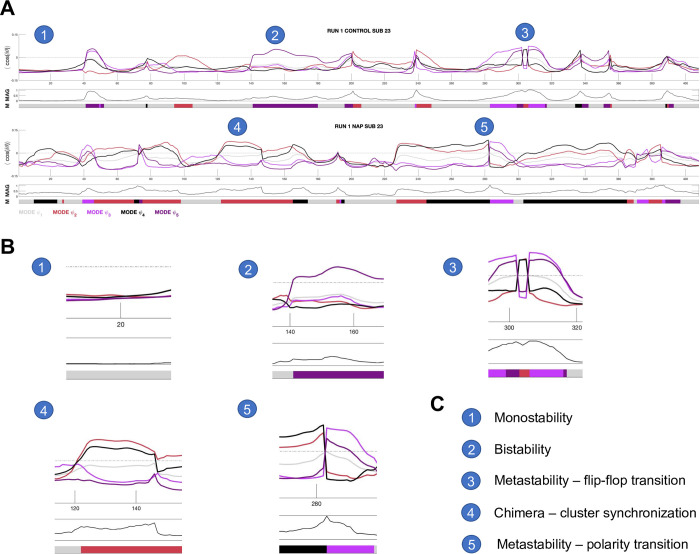
Fig 1. Diversity of phase-locking behavior.
A) Time-series of mode eigenvectors from two subjects from the HCPEP dataset. Top panel shows phase-locking behavior. Middle panel shows instantaneous magnetization which is the ratio of in-phase to antiphase regions. Bottom panel shows the mode assigned to the timepoint from k-means clustering. Interesting behavior is indicated with numbered circles. B) Blow-outs for points 1 to 5. C) Legend for the numbered circles. MAG, magnetization; M, mode. Gray dotted line shows where phase-locking is equal to zero.

