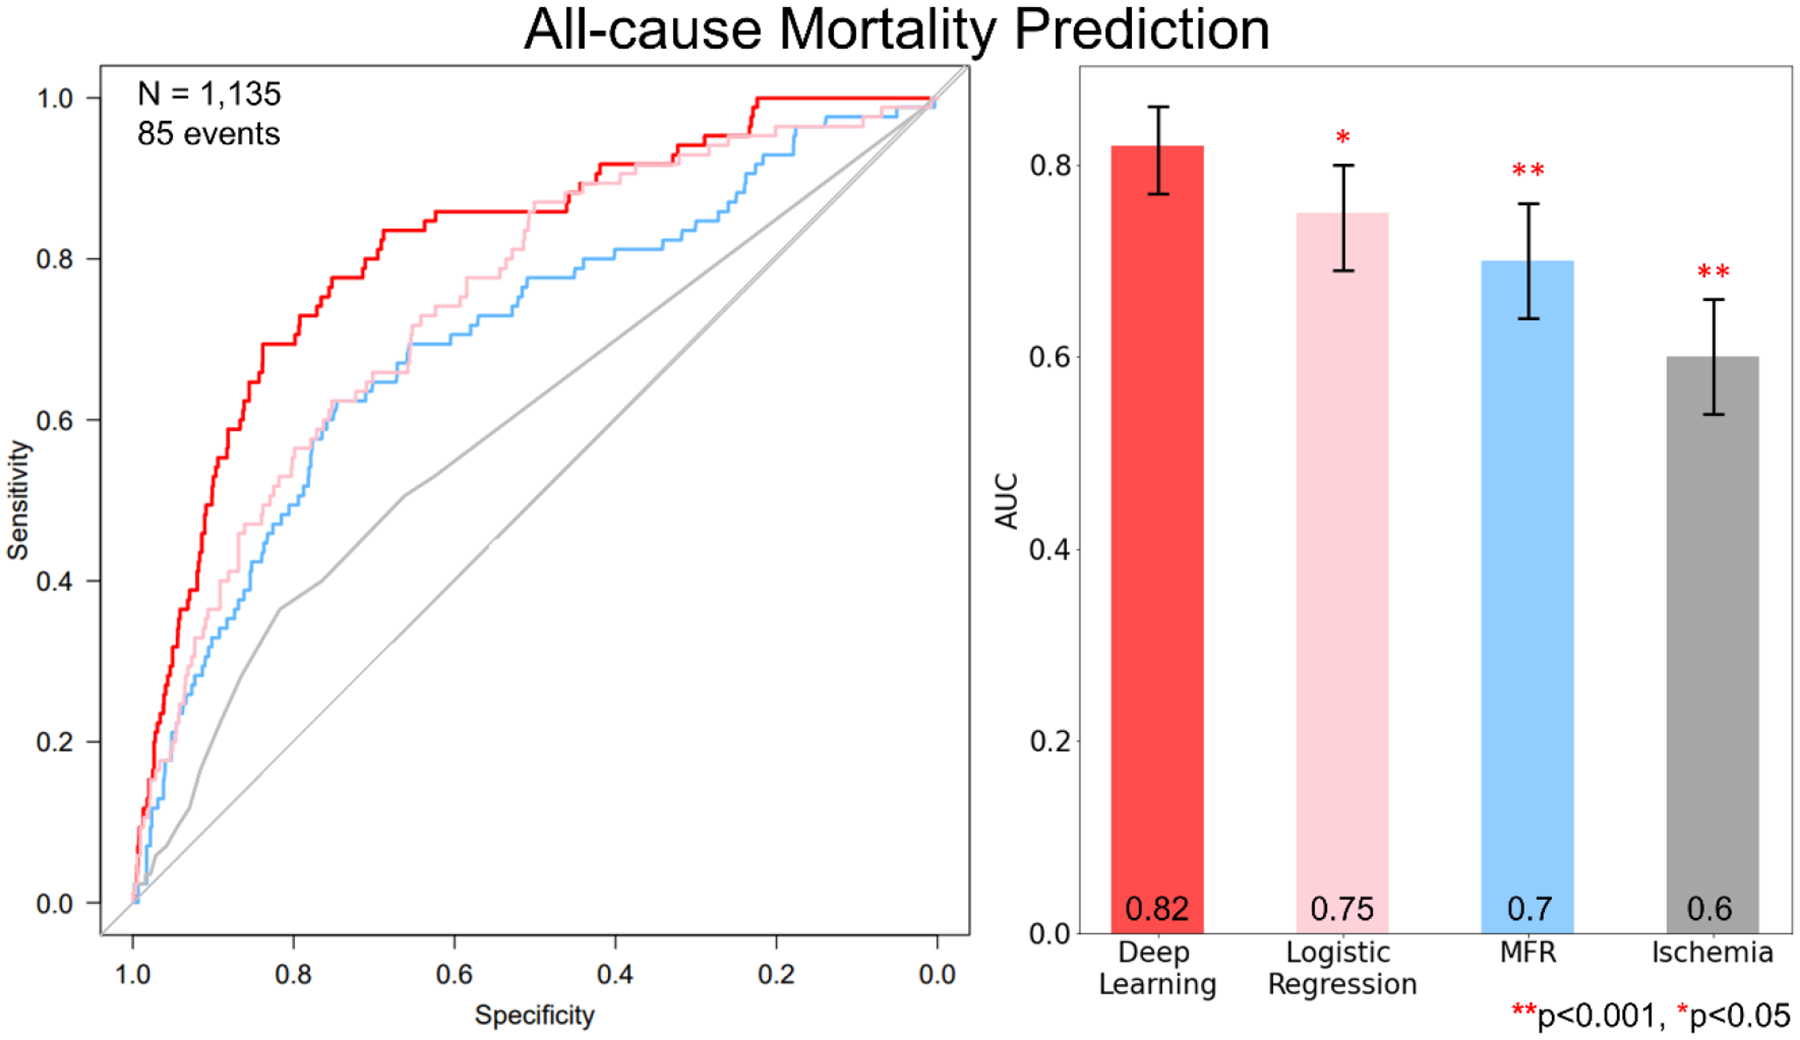
Figure 2: Per-patient AUC (left) and bar plot with AUC values (right) for the prediction of ACM in the prospective testing set by DL, MFR and ischemia.

Prediction by DL had a significantly larger area under receiver-operating characteristic curve than measures of percent myocardial ischemia, MFR and logistic regression in the prospective testing set.
AUC: area under curve, DL: deep learning, MFR: myocardial flow reserve
