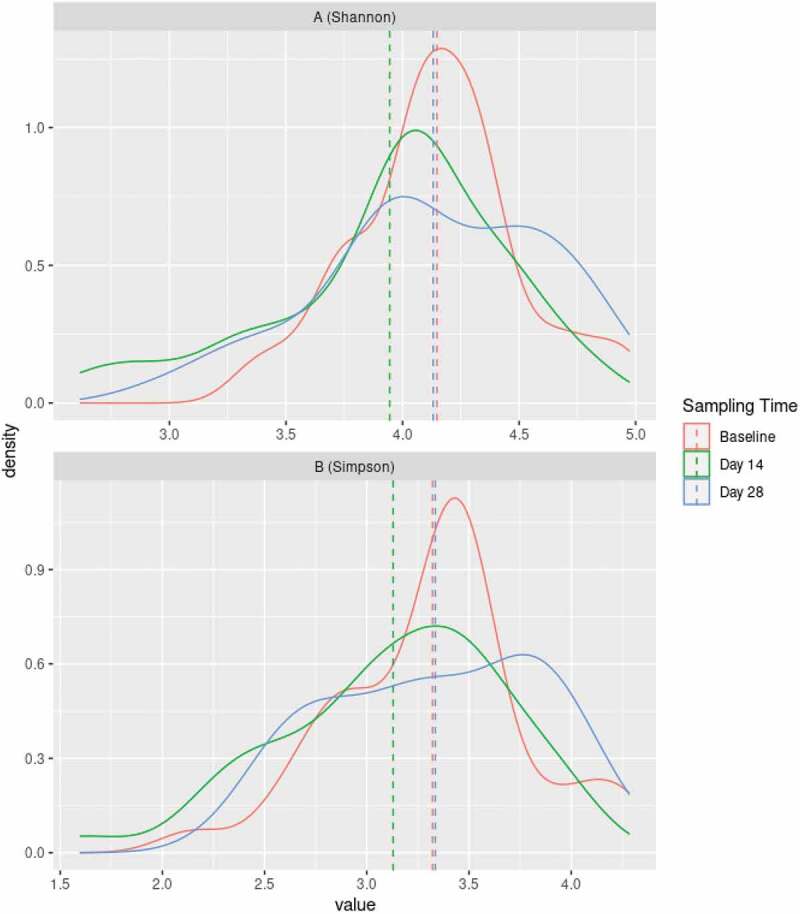
Figure 4.

Changes in diversity induced by sugar stress. Density plots based on Shannon index (A) and Simpson index (B) at baseline (red line), two weeks after sugar stress (green line), and two weeks after discontinuation of sugar stress at week 4 (blue line).
