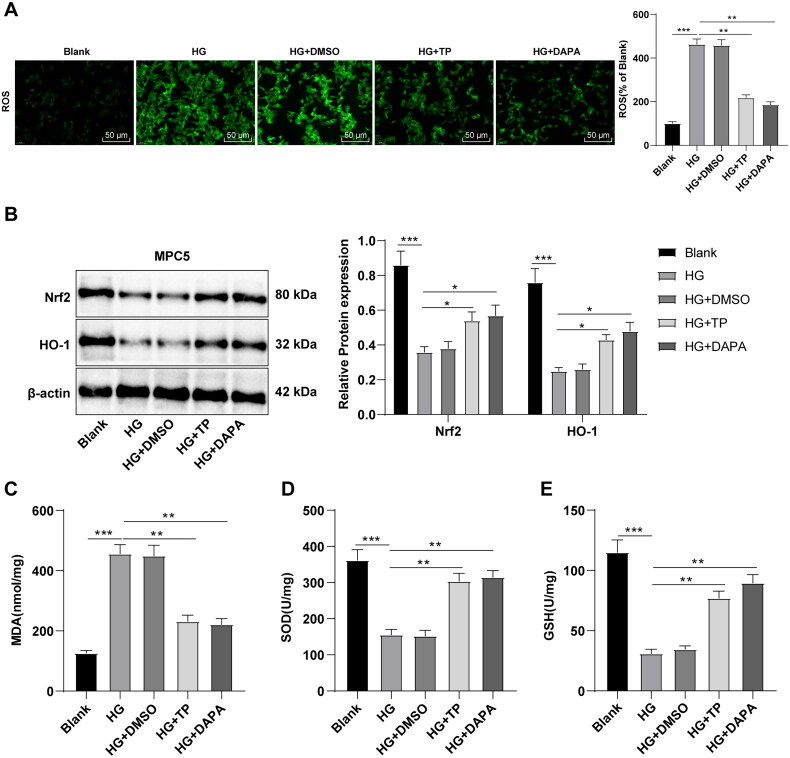
Figure 6.
TP activated the Nrf2 pathway to reduce OS induced by HG in MPC5 cells. (A) ROS levels in MPC5 cells were detected by a DCFH-DA fluorescence probe; (B) WB was used to detect Nrf2 and HO-1 protein levels; (C–E) The MDA, SOD, and GSH levels were determined. Data were expressed as mean ± SD; cell experiments were independently repeated three times. One-way ANOVA was used for data comparison among multiple groups and Tukey’s test was used for the post-hoc test. *p < 0.05, **p < 0.01, ***p < 0.001.

