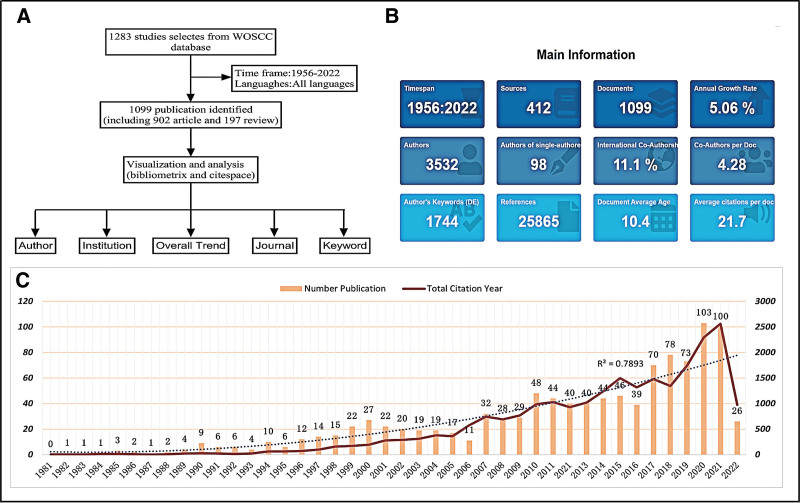
Figure 1.
(A) Research flow chart. (B) Main information involved in MPS. (C) General trends in publications and citations 1981 to 2022. The left vertical axis represents the annual number of publications, and the right vertical axis represents the annual total citations. The dotted line in the figure is the trend line for the number of publications. MPS = Myofascial Pain Syndromes.

