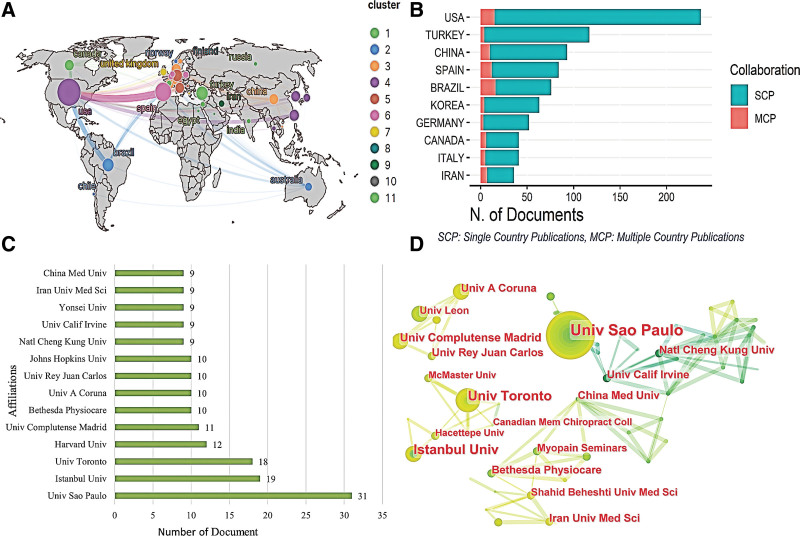
Figure 2.
(A) World Collaborative Relationships Map. Each node in the figure represents 1 country, and the node size positively relates to the number of publications, and the line between nodes represents the cooperative relationship. The thicker the line, the closer the relationship. (B) Comparison of single-country publications and multiple country publications from different countries. (C) Top 14 most productive institutions between 1956 and 2022. (D) The co-authorship network visualization map of institutions for MPS research. Each node in the figure represents 1 institution, and the larger the circle represents, the higher the “Degree” of the institution. The lines between the circles represent the cooperative relationship between the institutions, and the thicker the lines, the closer the cooperative relationship. MCP = multiple country publications, SCP = single-country publications.

