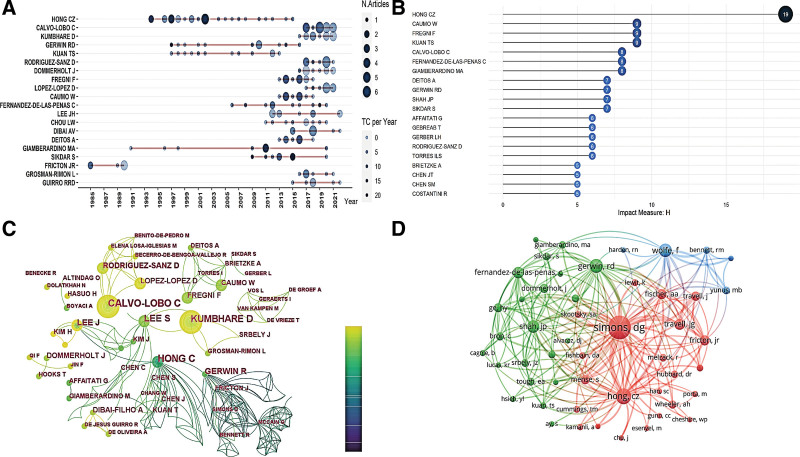
Figure 3.
(A) Authors’ Production over time involved in MPS. (B) Authors’ H-index in MPS. (C) A CiteSpace visualization map of authors involved in MPS. Each node in the figure represents 1 author, and the larger the circle represents, the higher the “Degree” of the author. The lines between the circles represent the cooperative relationship between the authors. The color of nodes ranges from dark to light, representing the published literature from early to recent. (D) A VOSviewer visualization map of co-cited authors involved in MPS. Each node in the figure represents 1 author, and the node size positively correlates with the cited frequency. Each color represents a cluster, and the connection thickness between nodes positively correlates with the co-citation frequency. MPS = Myofascial Pain Syndromes.

