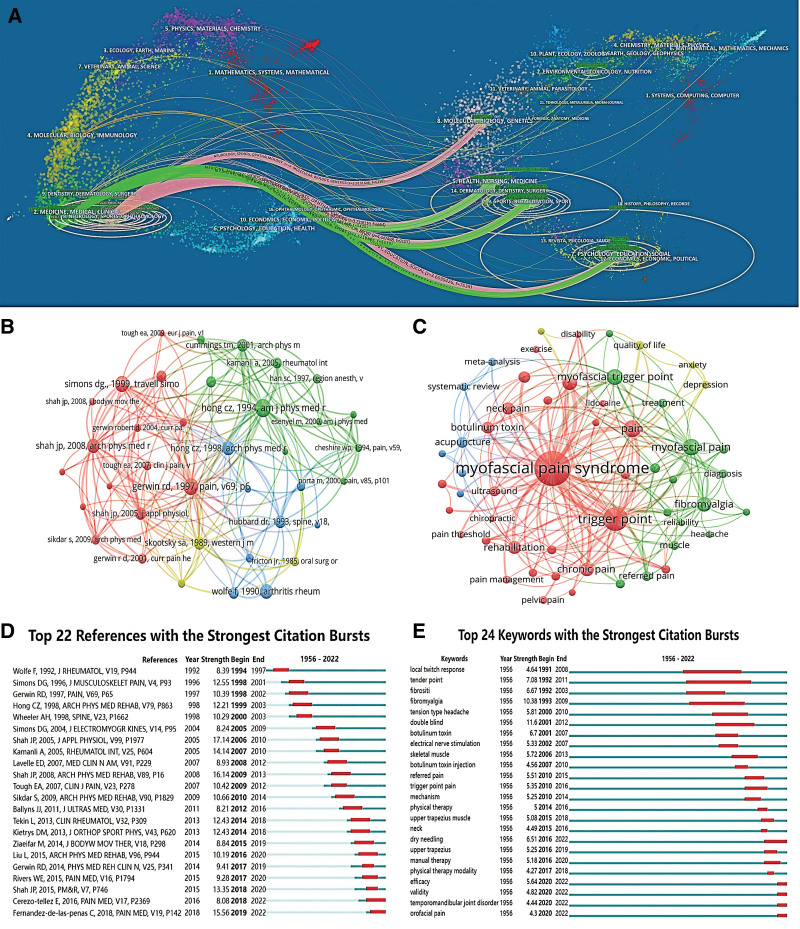
Figure 4.
(A) The dual-map overlay of journals on MPS. On the journal’s dual map overlay results, the citing graph is on the left, and the cited graph is on the right. The curve is the citation line, which completely shows the citation relationship. In the figure on the left, the more literature the journal publishes, the longer the vertical axis of the ellipse; the more the number of authors, the longer the horizontal axis of the ellipse. (B) The co-citation network visualization map of references on MPS research between 1956 and 2022. Each node in the map represents a paper, and the node’s size is positively correlated with the citation frequency of the paper. Each color represents a cluster, and the thickness of the node connection is positively correlated with the co-citation frequency. (C) The co-occurrence network visualization map of keywords on MPS research between 1956 and 2022. Each node in the map represents a keyword, and the node’s size is positively correlated with the frequency of keyword occurrence. Each color represents a cluster, and the thickness of the node connection is positively correlated with the number of times the keywords appear in the same paper. (D) The top 22 references with the strongest citation bursts on MPS research from 1956 to 2022. The red line in the figure represents the time when the reference bursts. (E) The top 24 keywords with the strongest citation bursts on MPS research from 1956 to 2022. The red line in the figure represents the time when the keyword bursts. MPS = Myofascial Pain Syndromes.

