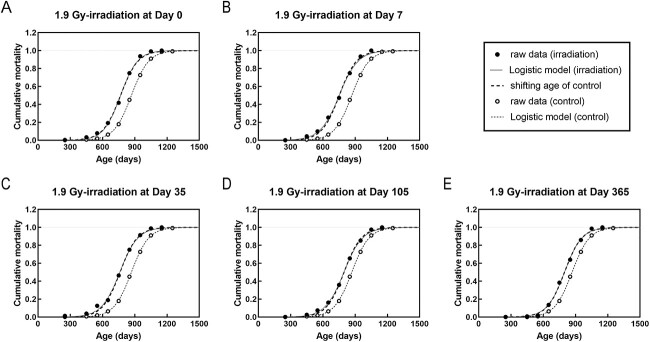
Fig. 2.
Cumulative mortality fitting curves for mice exposed to 1.9 Gy irradiation for all causes of death in the control (nonirradiated) and 1.9 Gy-irradiated groups. (A–E) Mice were irradiated at days 0 (A), 7 (B), 35 (C), 105 (D) and 365 (E). Circles are the raw data. Solid and dashed lines are data fitted by the logistic model. Dotted lines are the shifted lines to estimate the mortality of the irradiated group from the nonirradiated group.

