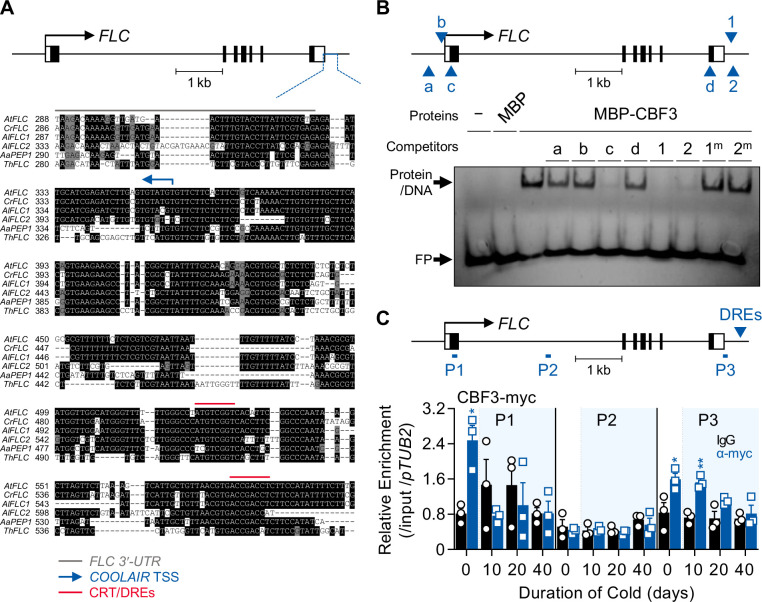
Figure 1. CBF3 directly binds to the CRT/DREs at the 3′-end of FLC.
(A) Comparison of sequences around the 3′-end of the FLC orthologs from Arabidopsis relatives. The upper graphic presents the gene structure of AtFLC. The black bars, black lines, and white bars indicate exons, introns, and untranslated regions (UTRs), respectively. The blue line presents the region used for sequence comparison among six orthologous genes from five plant species. In the sequence alignment below, the gray line indicates the 3′-UTR of FLC orthologs, the blue arrow indicates the transcriptional start site (TSS) of AtCOOLAIR, and the red lines indicate CRT/DREs. At, Arabidopsis thaliana; Cr, Capsella rubella; Al, Arabidopsis lyrata; Aa, Arabis alpina; Th, Thellungiella halophila. (B) EMSA using one of the CRT/DREs located at the AtCOOLAIR promoter, DRE1, as a probe. In the upper graphic showing AtFLC gene structure, CRT/DRE-like sequences are marked as blue arrows and labeled as a, b, c, and d for CRT/DRE-like sequences and as 1 and 2 for CRT/DRE sequences. For the competition assay, these CRT/DRE-like sequences and mutant forms of DRE1 and DRE2 were used as competitors. A 100-fold molar excess of unlabeled competitors was added. No protein (−) or maltose-binding protein (MBP) were used as controls. FP, free probe. (C) ChIP assay result showing the enrichment of CBF3-myc protein on the AtFLC locus. Samples of NV, 10V, 20V, and 40V plants of pSuper:CBF3-myc were collected at zeitgeber time (ZT) 4 in an SD cycle. The CBF3-chromatin complex was immunoprecipitated (IP) with anti-myc antibodies (blue bars), and mouse IgG (black bars) was used as a control. Positions of qPCR amplicons used for ChIP-qPCR analysis are illustrated as P1, P2, and P3 in the upper graphic. The blue arrow in the graphic denotes the position of CRT/DREs on the AtCOOLAIR gene. ChIP-qPCR results have been represented as mean ± SEM of the three biological replicates in the lower panel. Open circles and squares represent each data point. Relative enrichments of the IP/5% input were normalized to that of pTUB2. The blue shadings indicate cold periods. Asterisks indicate a significant difference between IgG and anti-myc ChIP-qPCR results at each vernalization time point (*, p < 0.05; **, p < 0.01; unpaired Student’s t-test).
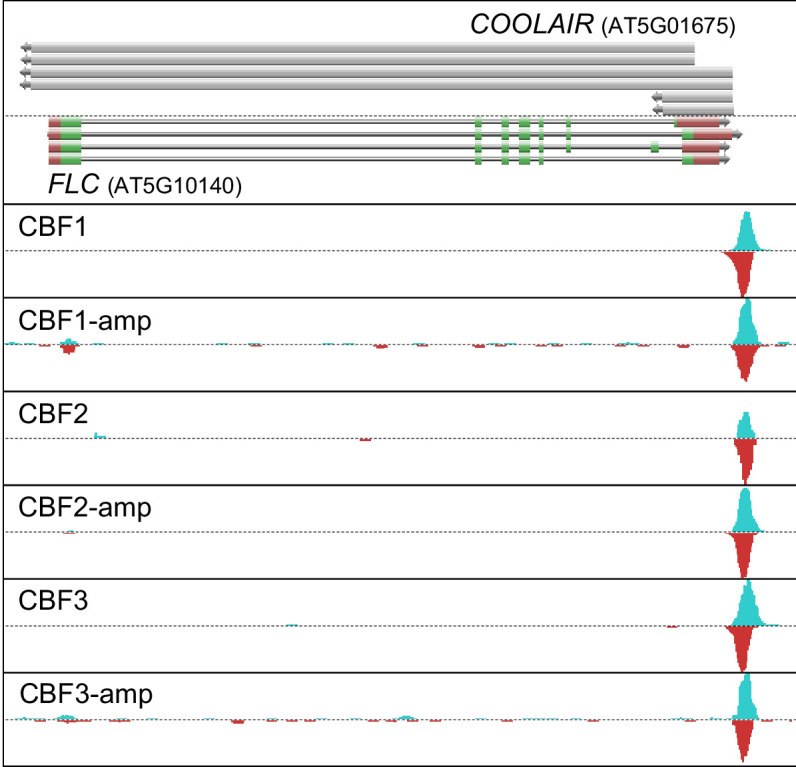
Figure 1—figure supplement 1. CBF proteins directly bind to the sequence at the 3′-end of FLC in DAP-seq.

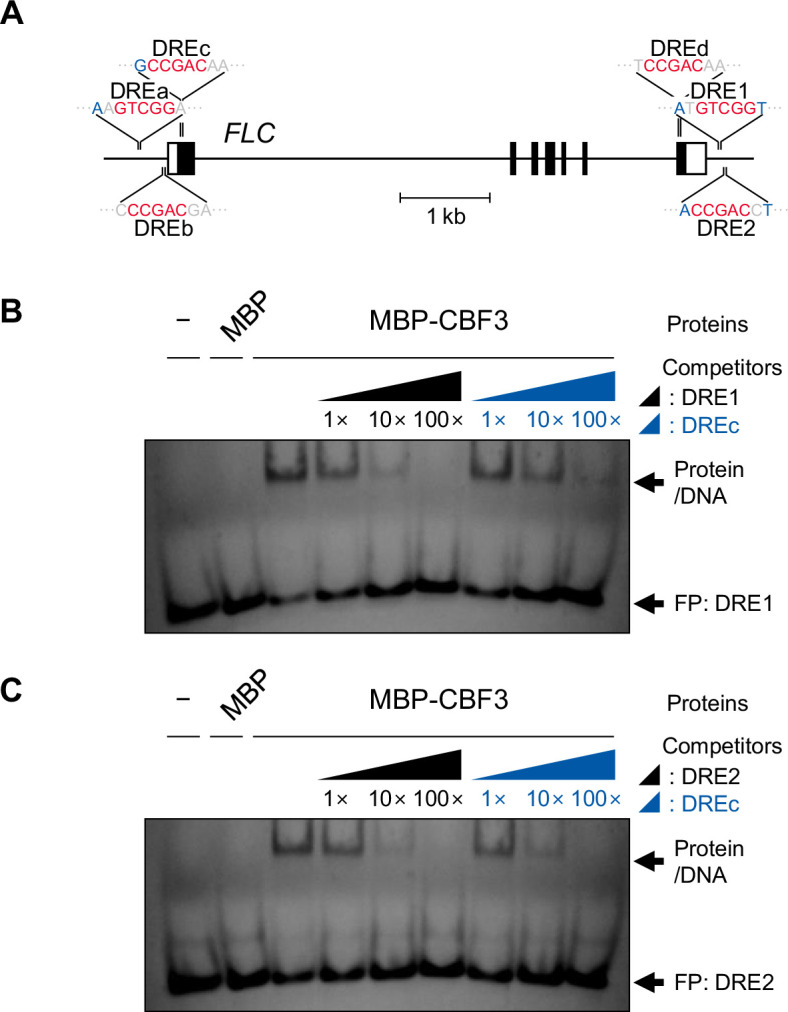
Figure 1—figure supplement 2. CBF3 binds to DRE1 and DRE2 on the COOLAIR promoter and DREc on the first exon of FLC.


