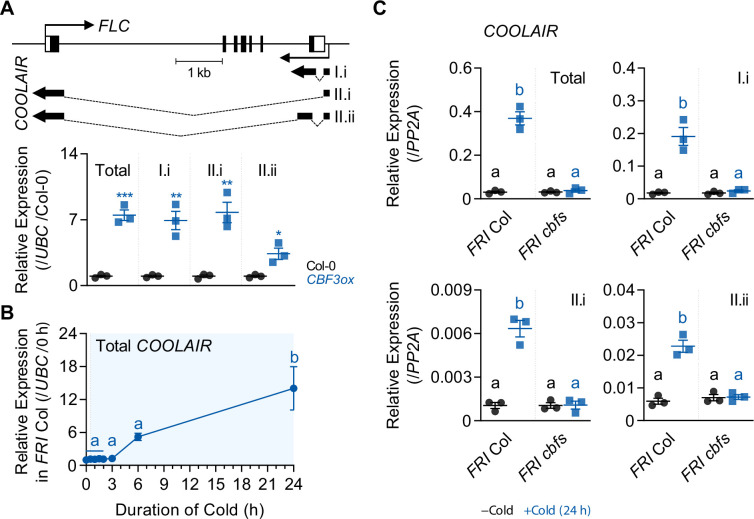
Figure 2. COOLAIR shows a similar expression pattern with CBF regulons.
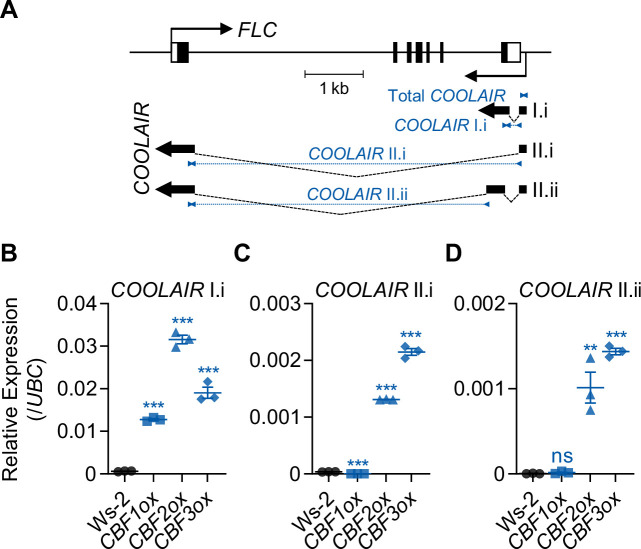
(A) Expression levels of total COOLAIR and COOLAIR isoforms in the wild-type (Col-0) and CBF3-overexpressing plants (pSuper:CBF3-myc [CBF3ox]). The gene structures of FLC and COOLAIR variants are illustrated in the upper panel. The thin black arrows indicate the transcription start sites of FLC and COOLAIR. The thick black arrows indicate the exons of each COOLAIR isoform. The structures of proximal (I.i) and distal (II.i and II.ii) COOLAIR isoforms are shown. The primer sets used for total, proximal (I.i), and distal (II.i, II.ii) COOLAIRs are marked in Figure 2—figure supplement 1. Relative transcript levels of total COOLAIR and COOLAIR variants were normalized to that of UBC and have been represented as mean ± SEM of three biological replicates. Dots and squares represent each data point. Asterisks indicate a significant difference as compared to the wild type (*, p < 0.05; **, p < 0.01; ***, p < 0.001; unpaired Student’s t-test). (B) Expression dynamics of total COOLAIR after short-term (0, 0.5, 1, 1.5, 2, 3, 6, and 24 hr) cold treatment. Wild types (FRI Col) were subjected to 4 °C cold and harvested at each time point. Relative transcript levels of total COOLAIR to UBC were normalized to that of non-cold treated wild type. The values have been represented as mean ± SEM of three biological replicates. The blue shading indicates periods under cold treatment. Significant differences have been marked using different letters (a, b; p < 0.05; one-way ANOVA followed by Tukey’s post-hoc test). (C) Transcript levels of total COOLAIR and COOLAIR isoforms in wild type and cbfs-1 mutant before (−Cold) and after (+Cold) a day of 4 °C cold treatment. Relative levels of total COOLAIR and COOLAIR variants were normalized to that of PP2A. Values have been represented as mean ± SEM of three biological replicates. Dots and squares indicate each data point. Significant differences have been marked using different letters (a, b; p < 0.05; two-way ANOVA followed by Tukey’s post-hoc test).


