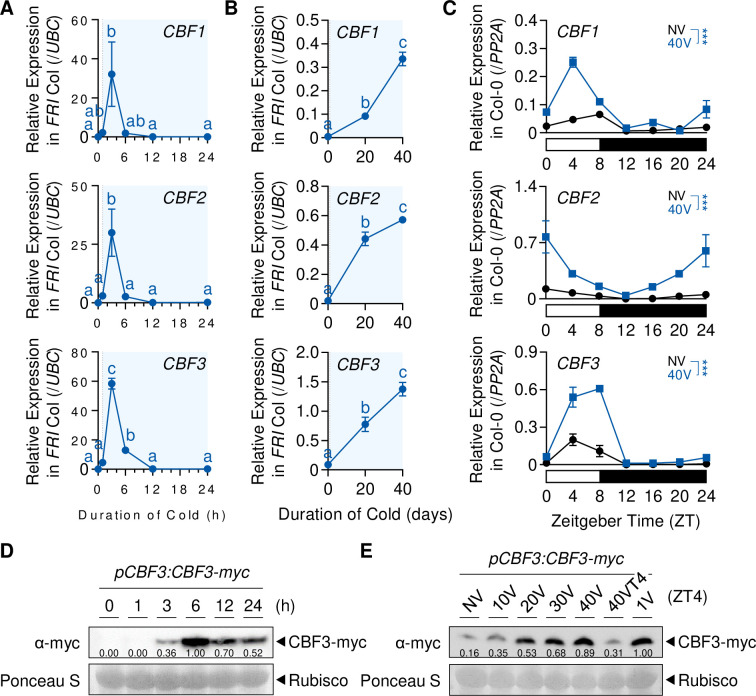
Figure 3. Protein levels of CBFs increase during the vernalization process.
(A) Transcript levels of CBF1, 2, and 3 under short-term cold exposure. Wild-type plants were subjected to 0, 1, 3, 6, 12, and 24 hr of 4 °C cold treatment. Relative levels of CBF1, 2, and 3 were normalized to that of UBC. Values have been represented as mean ± SEM of three biological replicates. The blue shadings indicate cold periods. Significant differences have been marked using different letters (a–c; p < 0.05; one-way ANOVA followed by Tukey’s post-hoc test). (B) Transcript levels of CBF1, 2, and 3 after 20V and 40V. Wild-type plants were treated with 4 °C vernalization under an SD cycle and collected at ZT4. Relative levels of CBF1, 2, and 3 were normalized to that of UBC. Values have been represented as mean ± SEM of three biological replicates. The blue shadings denote periods under cold. Significant differences have been marked using different letters (a–c; p < 0.05; one-way ANOVA followed by Tukey’s post-hoc test). (C) Daily rhythms of CBF1, 2, and 3 transcript levels in NV or 40V plants. Col-0 plants grown under an SD cycle were collected every 4 hr between ZT0 and ZT24. Relative transcript levels of CBF1, 2, and 3 were normalized to that of PP2A. Values have been represented as mean ± SEM of three biological replicates. The white and black bars represent light and dark periods, respectively. Asterisks indicate a significant difference between NV and 40V (***, p < 0.001; two-way ANOVA). (D) Dynamics of CBF3 protein level under short-term cold exposure. The pCBF3:CBF3-myc transgenic plants were subjected to 0, 1, 3, 6, 12, and 24 hr of 4 °C cold treatment. CBF3 proteins were detected using anti-myc antibodies. Rubisco was considered the loading control. Numbers below each band indicate relative signal intensity compared to 6 hr. The mean values of two biological replicates are presented. (E) Increase of CBF3 protein level during the vernalization process. The pCBF3:CBF3-myc transgenic plants, subjected to 4 °C vernalization, were collected at ZT4 of the indicated time point. CBF3 proteins were detected using anti-myc antibodies. Rubisco was considered the loading control. Numbers below each band indicate relative signal intensity compared to 1V. The mean values of three biological replicates are presented.


