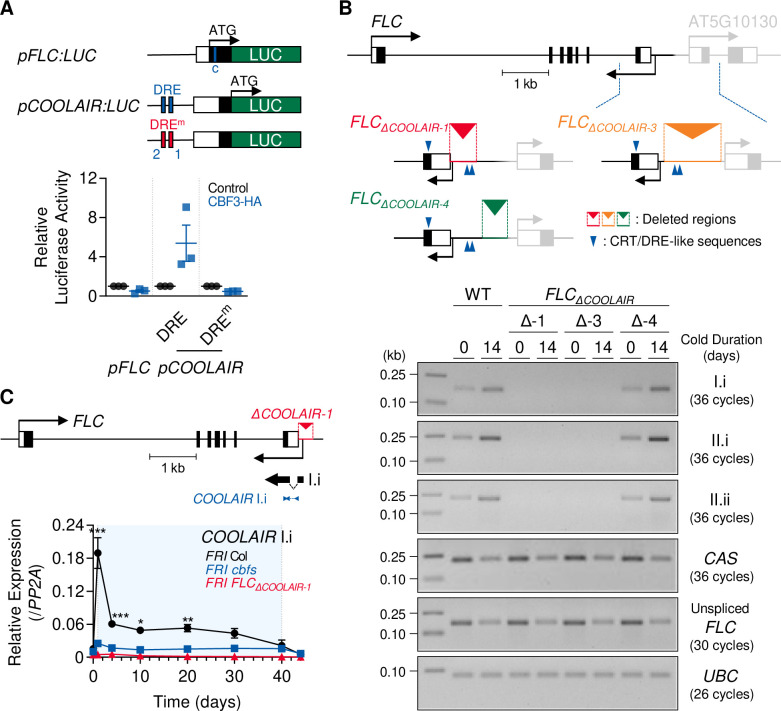
Figure 5. COOLAIR promoter region containing CRT/DREs is necessary for the COOLAIR induction by vernalization.
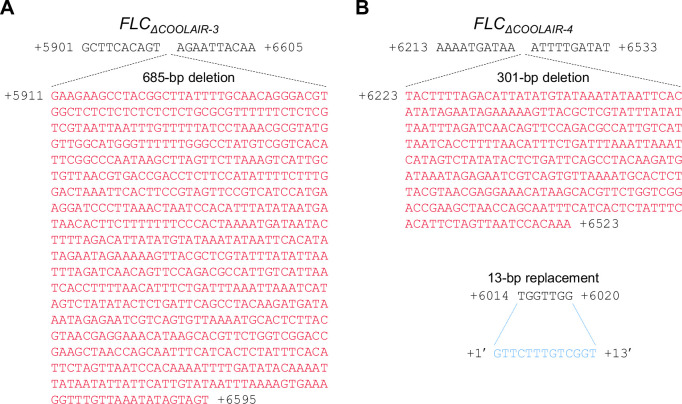
(A) Arabidopsis protoplast transfection assay showing that CBF3 activates COOLAIR promoter with wild-type CRT/DRE (DRE) but fails to activate the one with mutant CRT/DRE (DREm). A schematic of the reporter constructs used for the luciferase assay is presented in the upper panel. pFLC:LUC contains 1 kb of the promoter, the 5′-UTR, and the first exon of FLC. The blue line in the pFLC:LUC graphic indicates the location of DREc. Wild-type and mutant forms of pCOOLAIR:LUC include 1 kb of the COOLAIR promoter with the 3′-UTR and the last exon of FLC. The blue and red lines mark the positions of the wild-type (DRE) and mutant (DREm) forms of DRE1 and DRE2, respectively. Each reporter construct was co-transfected into Arabidopsis protoplast together with the 35S:CBF3-HA effector construct. In parallel, 35S-NOS plasmid was transfected as a control. The result is shown below. Relative luciferase activities were normalized to that of the 35S-NOS control. Values have been represented as mean ± SEM of three biological replicates. Dots and squares represent each data point. (B) Transcript levels of proximal (I.i) and distal (II.i and II.ii) COOLAIR isoforms in wild-type, FLCΔCOOLAIR-1, FLCΔCOOLAIR-3, and FLCΔCOOLAIR-4 plants before and after 14 days of vernalization. FLCΔCOOLAIR-1 and FLCΔCOOLAIR-3 have a 324- and 685 bp deletion of the COOLAIR promoter region, respectively, where DRE1 and 2 are located. FLCΔCOOLAIR-4 has a deletion in the 301 bp COOLAIR promoter region outside of DRE1 and 2 location. The positions of the deleted region are marked in red, orange, and green lines with reversed triangle in the upper graphic. Blue arrows denote CRT/DRE-like sequences. Black and gray bars denote exons, thin lines denote introns, and white bars denote UTRs of FLC and its neighboring gene (AT5G10130). Results of RT-PCR analysis are shown below. UBC was used as a quantitative control. (C) Transcript levels of proximal (I.i) COOLAIR isoform in wild-type, cbfs-1, and FLCΔCOOLAIR-1 plants during vernalization. The position of the deleted region is marked in red lines with a reversed triangle in the upper graphic. Black bars denote exons, thin lines denote introns, and white bars denote UTRs of FLC. The thin black arrow below the gene structure indicates the transcriptional start site of COOLAIR. The thick black arrow below denotes exons of the type I.i COOLAIR variant. The position of the amplicon used for the qPCR analysis is marked with blue arrows. The result of qPCR analysis is presented in the lower panel. Relative transcript levels were normalized to that of PP2A. Values have been represented as mean ± SEM of three biological replicates. The blue shading indicates periods under cold treatment. Asterisks indicate a significant difference, as compared to NV (*, p < 0.05; **, p < 0.01; ***, p < 0.001; two-way ANOVA followed by Tukey’s post-hoc test).


