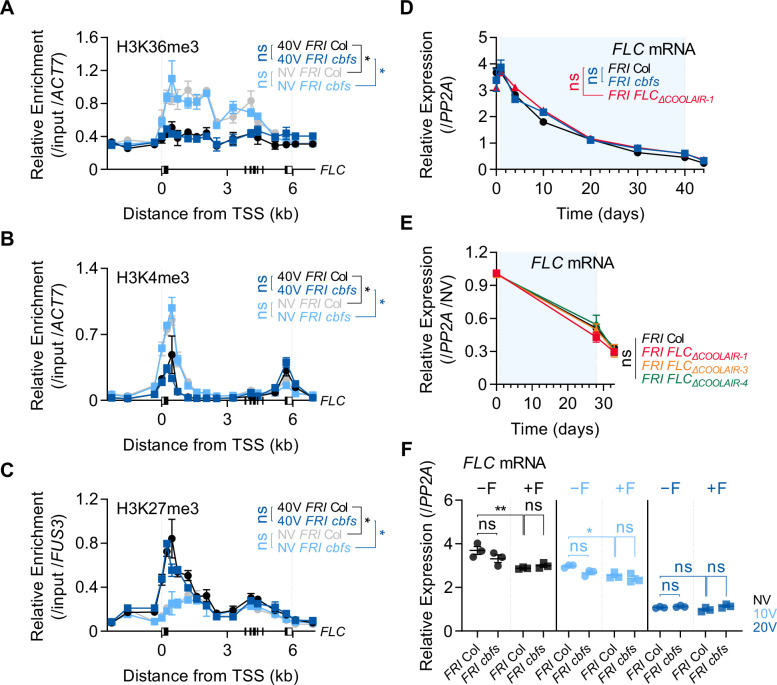
Figure 6. Vernalization-triggered epigenetic silencing of FLC is not affected by CBFs-mediated COOLAIR induction.
(A–C) Enrichments of H3K36me3 (A), H3K4me3 (B), and H3K27me3 (C) on the FLC locus in NV or 40 V wild-type and cbfs-1 plants. The whole seedlings were collected at ZT4 under an SD cycle. Modified histones were immunoprecipitated with anti-H3K36me3, anti-H3K4me3, or anti-H3K27me3 antibodies. H3K36me3, H3K4me3, and H3K27me3 enrichments of the IP/5% input were normalized to those of ACT7 or FUS3. Relative enrichments have been represented as mean ± SEM of three biological replicates. One-way ANOVA and Tukey’s post-hoc test were performed on the ChIP results obtained using two primer pairs corresponding to the FLC nucleation region (Yang et al., 2017). Asterisks indicate a significant difference (*, p < 0.05). ns, not significant (P ≥ 0.05). (D) Transcript levels of FLC mRNA in wild-type, cbfs-1 and FLCΔCOOLAIR-1 plants during and after vernalization. Blue shading denotes cold periods. Relative levels were normalized to that of PP2A. Values have been represented as mean ± SEM of three biological replicates. ns, not significant between wild type and mutants, as assessed using two-way ANOVA followed by Tukey’s post-hoc test (p ≥ 0.05). (E) Transcript levels of FLC mRNA in wild type, FLCΔCOOLAIR-1, FLCΔCOOLAIR-3, and FLCΔCOOLAIR-4 during and after vernalization. Blue shading denotes cold periods. Relative levels were normalized to that of PP2A, and then normalized to NV of each genotype. Values have been represented as mean ± SEM of three biological replicates. ns, not significant between wild type and mutants, as assessed using two-way ANOVA followed by Tukey’s post-hoc test (p ≥ 0.05). (F) Effect of the first frost-mimicking treatment (8 hr freezing) on the FLC mRNA level in wild type and cbfs-1 after vernalization. NV, 10V, 20V, NV +F, 10V+F, and 20V+F plants were subjected to the treatments described in Figure 4C. Relative levels were normalized to that of PP2A. Values have been represented as mean ± SEM of three biological replicates. Dots and squares represent each data point. Asterisks indicate a significant difference (*, p < 0.05; **, p < 0.01; two-way ANOVA followed by Tukey’s post-hoc test). ns, not significant (p ≥ 0.05).

