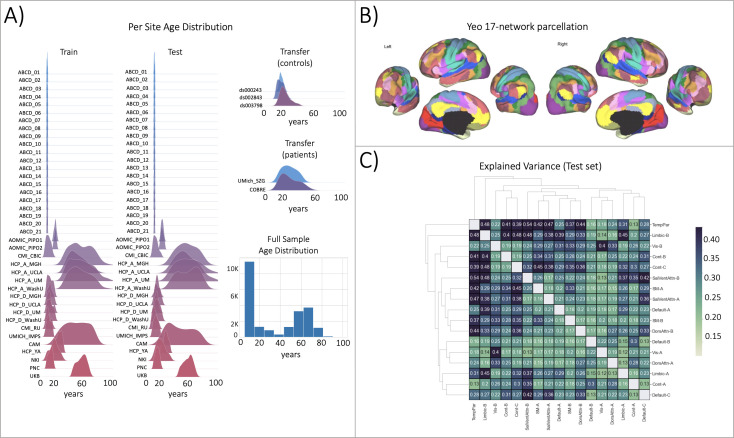
Figure 2. Functional brain network normative modeling.
(A) Age distribution per scanning site in the train, test, and transfer data partitions and across the full sample (train +test). (B) The Yeo-17 brain network atlas is used to generate connectomes. Between network connectivity was calculated for all 17 networks, resulting in 136 unique network pairs that were each individually input into a functional normative model. (C) The explained variance in the controls test set (N=7244) of each of the unique 136 network pairs of the Yeo-17 atlas. Networks were clustered for visualization to show similar variance patterns.

