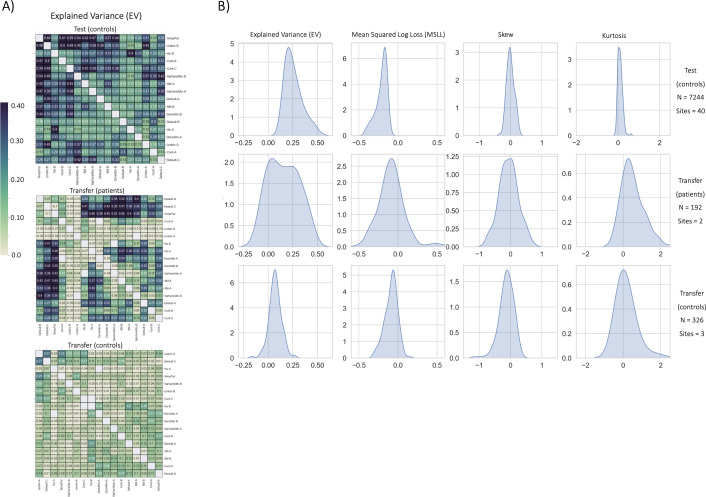
Figure 3. Functional normative model evaluation metrics.
(A) Explained variance per network pair across the test set (top), and both transfer sets (patients – middle, controls – bottom). Networks were clustered for visualization to show similar variance patterns. (B) The distribution across all models of the evaluation metrics (columns) in the test set (top row) and both transfer sets (middle and bottom rows). Higher explained variance (closer to one), more negative MSLL, and normally distributed skew and kurtosis correspond to better model fit.

