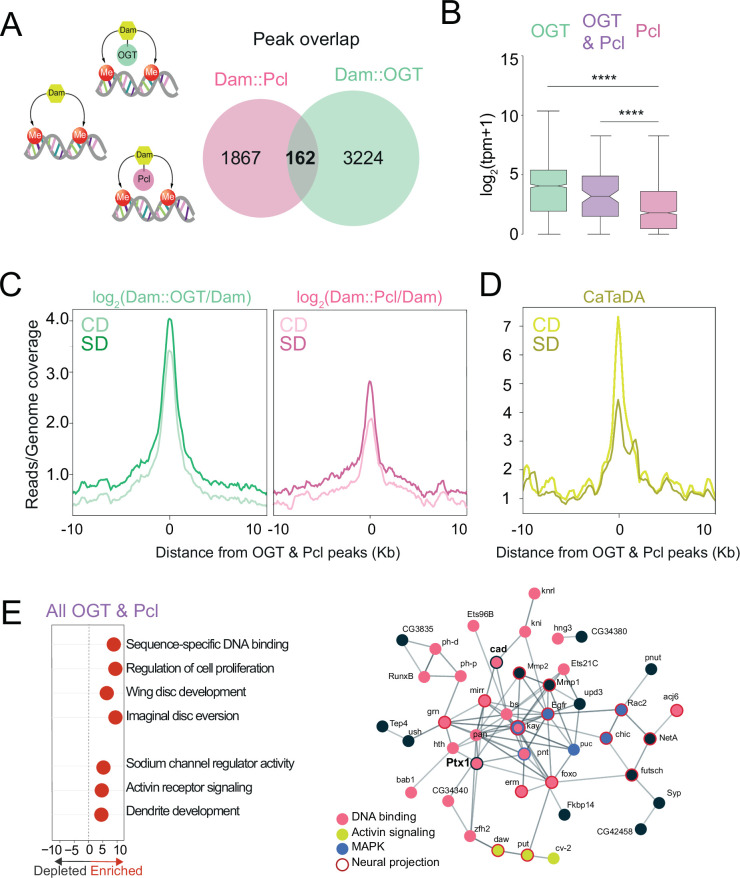
Figure 2. O-GlcNAc Transferase (OGT) and Polycomb Repressive Complex 2.1 (PRC2.1) mark nutrient-sensitive chromatin in the sweet-taste cells.
(A) Diagram of the Targeted Dam-ID (TaDa occupancy, Dam::OGT green, and Dam::Pcl pink) and (CATaDa, accessibility, yellow) experiments analyzed in this figure. Overlap of log2(Dam::Pcl/Dam, pink) and log2(Dam::OGT/Dam, green) chromatin occupancy peaks (all peaks, peak calling: find_peaks, q<0.01). (B) The distribution in normalized reads (Transcript Per Million, TPM +1) for genes occupied by OGT (green), Pcl (pink), and OGT and Pcl (purple). Two-tailed t test, ****p<0.0001. (C) Average log2(Dam::OGT/Dam; left) and log2(Dam::Pcl/Dam) (right) signal on a CD (lighter shades) and SD (darker shades) diet centered at OGT + Pcl co-occupied peaks. (D) Average CATaDa signal on CD (lighter shade) and SD (darker shade) centered at OGT + Pcl co-occupied peaks. (E) (left) iPAGE pathway analysis of genes co-occupied by OGT and Pcl and (right) STRING interaction network of genes co-occupied by OGT + Pcl, colors represent GO terms from the pathway enrichment analysis.

