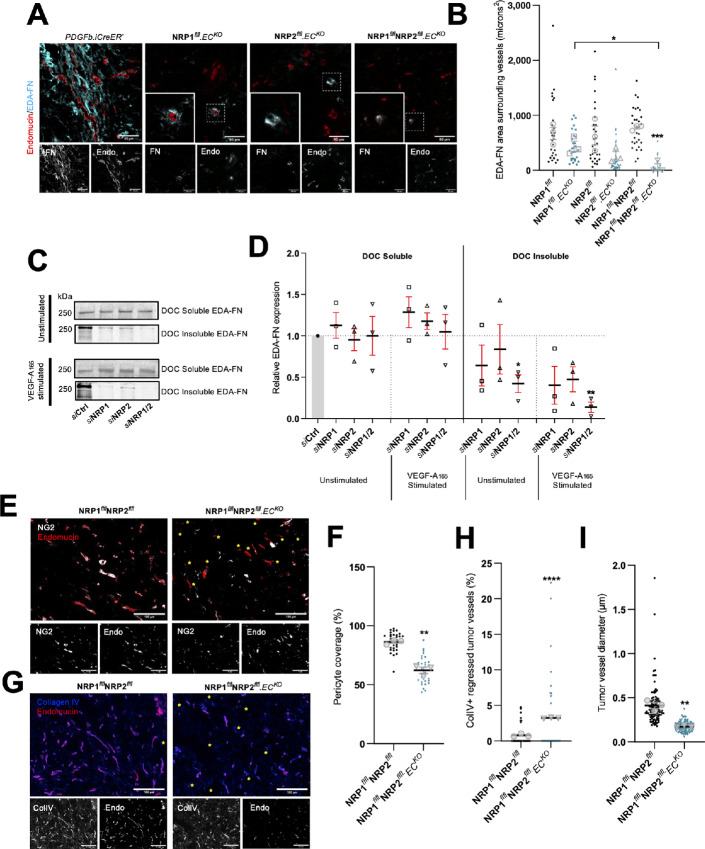
FIGURE 2.
NRP.ECKO tumor vasculature displays reduced pericyte coverage and EDA-fibronectin fibrillogenesis. A, Representative tumor sections from Cre-negative and Cre-positive tumors showing EDA-FN coverage around endomucin+ blood vessels. Scale bar = 100 μm. Note: PDGFb.iCreER− endomucin image panels in A and Fig. 5A are duplicated as a result of multiple antibody labeling on a single section. B, Quantification of mean EDA-FN area (μm2) surrounding vessels, performed on ≥10 vessels/tumor. Error bars show mean ± SEM; n ≥ 3. C, siRNA-treated ECs were seeded onto 10 μg/mL FN for 48 hours, then incubated in serum-free OptiMEM for 3 hours. ECs were subject to 5 minutes of stimulation with 30 ng/mL VEGF-A before being washed twice on ice with PBS and lysed. Lysates were cleared by centrifugation for 30 minutes at 4°C, allowing for the isolation of soluble and insoluble fractions. Soluble and insoluble fractions were quantified using the DC protein assay, separated by SDS-PAGE and subjected to Western blot analysis. Membranes were incubated in anti-EDA-FN primary antibody. Panels show representative levels of EDA-FN expression quantified from soluble and insoluble fractions, in the presence or absence of VEGF-A stimulation. D, Quantification of relative EDA-FN expression shown in C. Quantification shows mean densitometric analysis obtained using ImageJ. Error bars show mean ± SEM; N = 3. E, Representative tumor sections from Cre-negative and Cre-positive tumors showing NG2+ pericyte coverage over endomucin+ blood vessels. Yellow asterixis label blood vessels without associated pericytes. Scale bar = 100 μm. F, Quantification of % pericyte coverage, performed on ≥10 ROIs/tumor. Error bars show mean ± SEM; n ≥ 3. G, Representative tumor sections from Cre-negative and Cre-positive tumors showing ColIV+ basement membrane sleeves colocalizing with endomucin+ blood vessels. Yellow asterixis label regressed ColIV+ endomucin− vessels. Scale bar = 100 μm. H, Quantification of % vessel regression, performed on ≥10 ROIs/tumor. Error bars show mean ± SEM; n ≥ 3. I, Quantification of endomucin+ tumor vessel diameter, performed on ≥200 vessels from three tumors. Error bars show mean ± SEM; n ≥ 3. Asterixis indicate significance.

