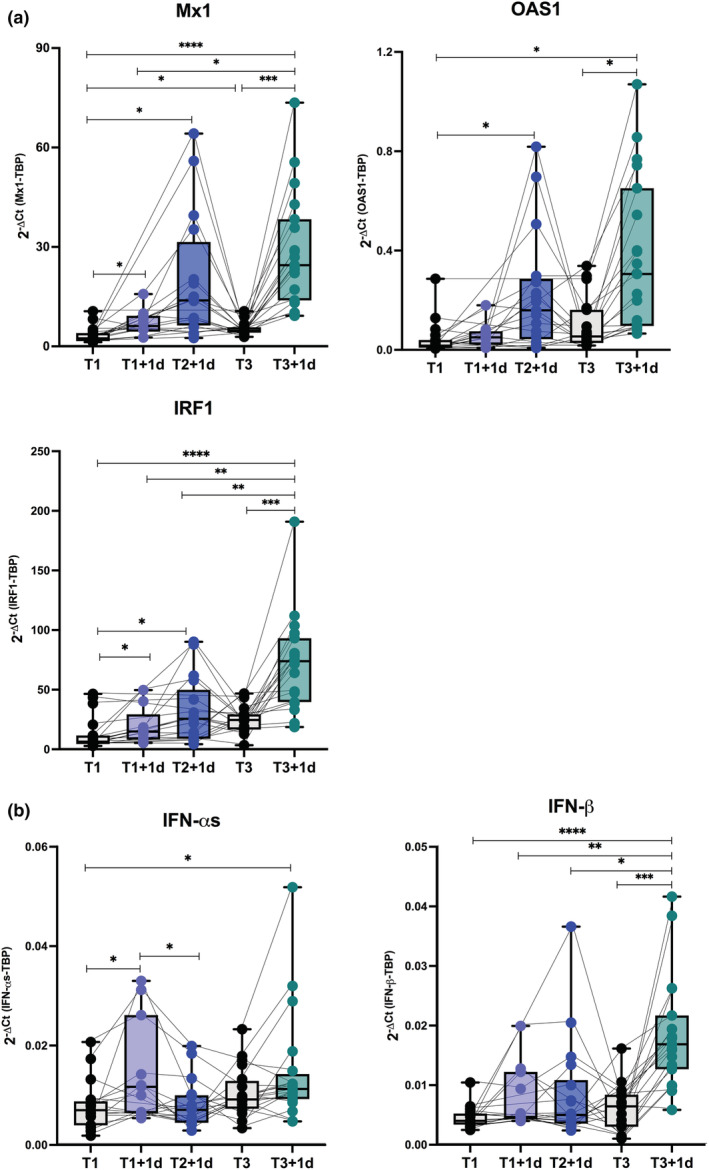
Figure 2.

Type I and II Interferon gene signature in healthy vaccine recipients. Freshly isolated peripheral blood mononuclear cells (PBMC) were collected from healthy subjects immediately before (T1, black dots) and 1 day after the first BNT162b2 vaccine dose (T1 + 1d, light blue dots), 1 day after the second vaccine dose (T2 + 1d, blue dots), before (T3, black dots) as well as 1 day after the third boosting dose (T3 + 1d, green dots). Relative expression of the interferon (IFN)‐stimulated genes Mx1, OAS1, IRF1 (a) and the type I IFN‐αs and IFN‐β genes (b) was measured by quantitative real time PCR analysis. Data were normalised to the housekeeping gene TATA‐binding protein (TBP) level by using the equation 2−ΔCt in cDNA derived from total RNA isolated from PBMC. P‐values were assigned as follows: * ≤ 0.05; ** ≤ 0.01; *** ≤ 0.001, **** ≤ 0.0001.
