
Figure 4.
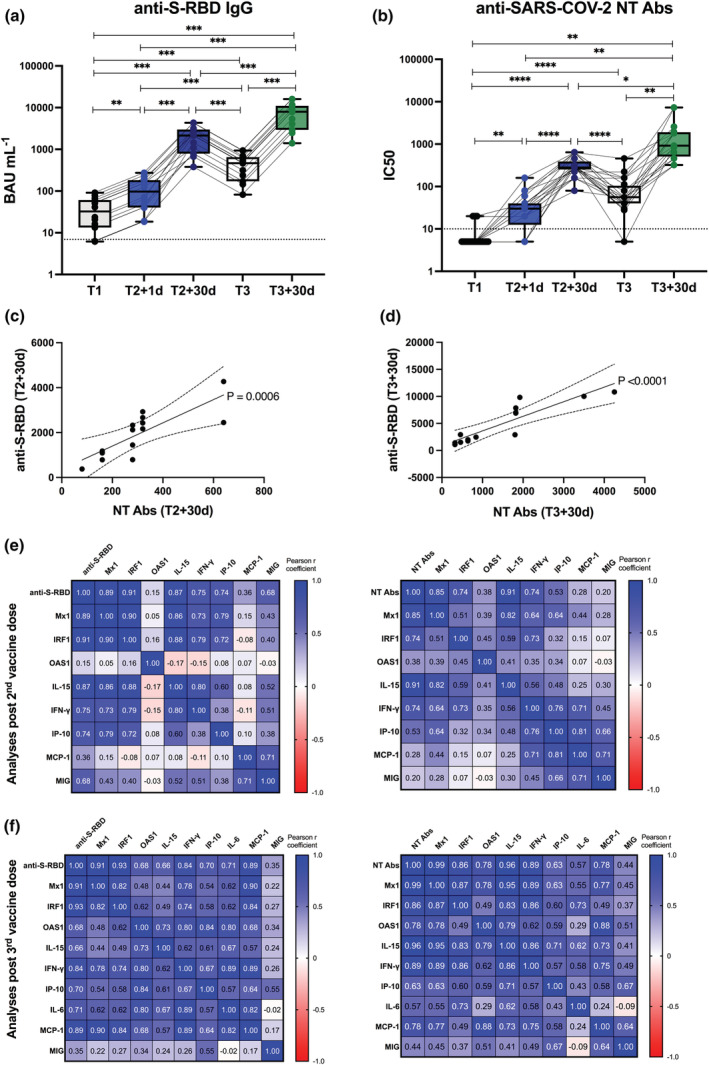
Vaccine‐specific antibody production and correlation with early innate signature in healthy recipients after II and III doses. (a, b) Levels of binding class G immunoglobulins recognising anti‐SARS‐CoV‐2 Spike‐receptor binding domain (anti‐S‐RBD‐IgG, expressed as BAU mL−1) (a) and neutralising antibodies (NT Abs, expressed as IC50) against wild‐type Wuhan SARS‐CoV‐2 variant (b) were measured in sera derived from BNT162b2 vaccinated healthy subjects longitudinally sampled immediately before the first vaccine dose (T1, black dots), 1 day and 30 days after the second dose (T2 + 1d, blue dots; T2 + 30d, dark blue dots), as well as before (T3, black dots) and 30 days after the third boosting dose (T3 + 30d, green dots). Dotted lines indicate cut‐off of positivity of each assay. P‐values were assigned as follows: * ≤ 0.05; ** ≤ 0.01; *** ≤ 0.001, **** ≤ 0.0001. (c, d) Correlation between serum levels of anti‐S‐RBD or NT Abs measured at T2 + 30d (c) or T3 + 30d (d) was calculated and reported as single linear regression curves. P‐values and 99% confidence bands of the best fit‐line are also shown for each slope. (e, f) Correlation matrices between anti‐S‐RBD‐IgG (left panels) or anti‐SARS‐CoV‐2 NT Ab titres (right panels), measured after second (e) and third dose (f) at T2 + 30d and T3 + 30d respectively, and correspondent early vaccine‐induced signature (measured at T2 + 1d or T3 + 1d) were constructed. Correlations were obtained by deriving a Pearson r correlation coefficient (positive correlation is indicated in shades of blue, while negative correlation is indicated in shades of red).