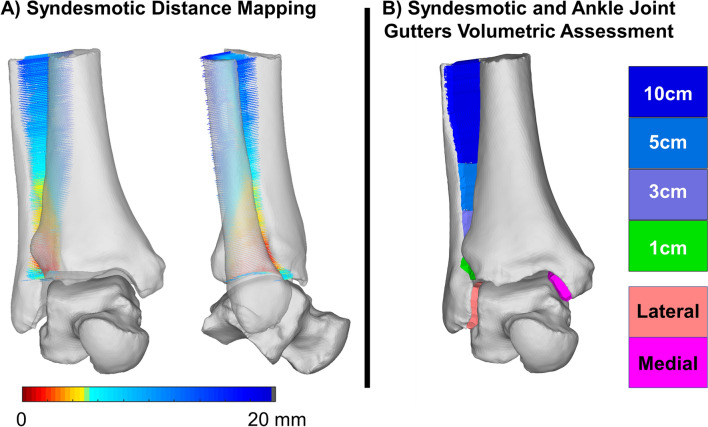
Figure 1.
Distal tibiofibular syndesmotic joint distance mapping (A) and volumetric analyses (B). Distance maps were created (Disior Ltd, Bonelogic 1.0, Helsinki, Finland, https://www.disior.com/ortho-foot-and-ankle) along the averaged normal directions between the interfacing regions of the distal tibia and fibula (A). The bounded volume of these interactions (Matlab, MATLAB 2019a, MathWorks, Massachusetts, USA, https://www.mathworks.com) was automatically measured at 4 levels (1, 3, 5 and 10 cm proximally to the ankle joint) and are shown in colors from green to dark blue with the medial and lateral gutters in pink and red, respectively (B).

