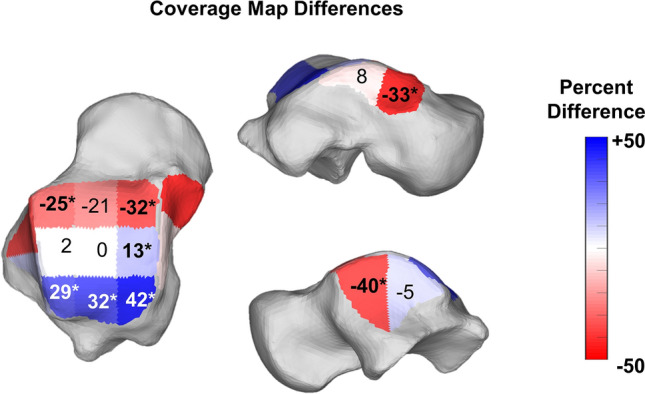
Figure 7.

Average percent differences on Coverage Maps for the nine zones of the talar dome as well as anterior and posterior aspects of the medial and lateral gutters of the ankle joint. Progressive Collapsing Foot Deformity (PCFD) minus Controls. Blue, white and red tones represent relative distances that are respectively higher, similar and smaller in PCFD patients. Bolded/starred regions denote significant changes (p value of the difference < .05).
