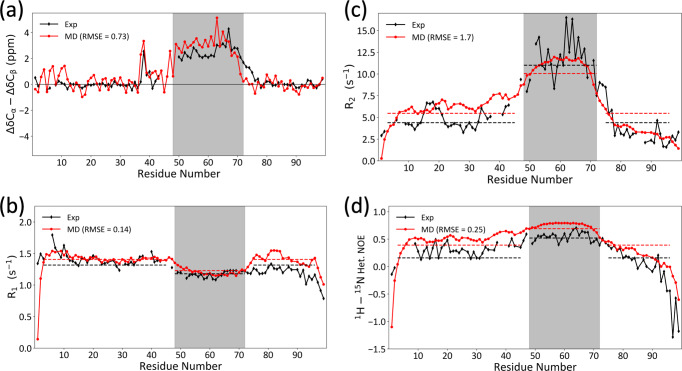
Fig. 2. Conformational and dynamic properties of FtsQ1-99 determined by solution NMR and MD simulations.
a Secondary chemical shifts (ΔδCα – ΔδCβ). For Gly residues, only ΔδCα are displayed. b–d R2, R1, and NOE. NMR data are shown in black; MD results are shown in red, with root-mean-square errors (RMSEs) indicated in legends. The core helical region, spanning residues 48 to 72, is shaded. Horizontal dashes indicate average values within the core helical region or non-helical region (residues 3–45 and 75–96).

