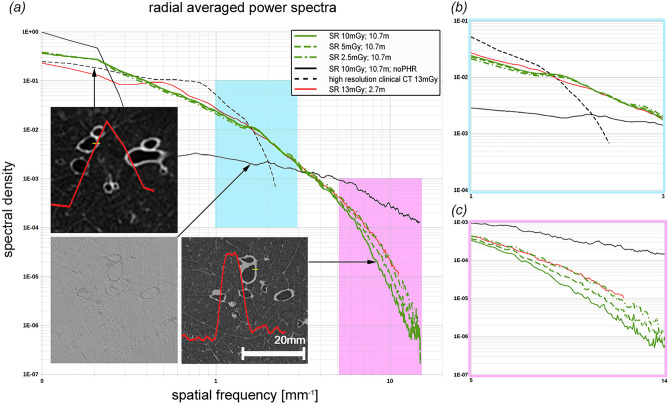
Figure 4.
Power spectra. (a) Shows radial averaged power spectra of lung regions of interest from the different measurements (clinical HRCT = black dashed, SR with an SDD of 2.7 m = red, SR with an SDD of 10.7 m at 10, 5 and 2.5 mGy green solid, dashed and dot-dashed subsequently the same data at 10 mGy but without phase retrieval is shown in solid black). Clearly, the phase retrieved synchrotron data demonstrates higher powers at medium spatial frequencies and lower powers at high frequencies (noise region) and has therefore a high image quality, which can also be seen in the inserted images. The red curves in the inserts depicts edge profiles at the positions indicated in yellow over a length of 2.5 mm. Despite the high contrast in the clinical data the limited in plane resolution of 450 µm clearly results in edges with a lower sharpness compared to the synchrotron data set. The highlighted region of the medium spatial frequencies (b) demonstrates that the images taken at 10.7 m surpass the data taken at 2.7 m at even higher dose of 13 mGy. Moreover, it can be seen that the data at 5 mGy does not deviate much from the results at 10 mGy and that only the data at 2.5 mGy shows a visible drop in power. In the enlarged high frequency domain (c) the known effect that phase retrieval acts as a low pass filter and therefore reduces the noise can be seen together with the fact that the noise level depends on the applied dose.

