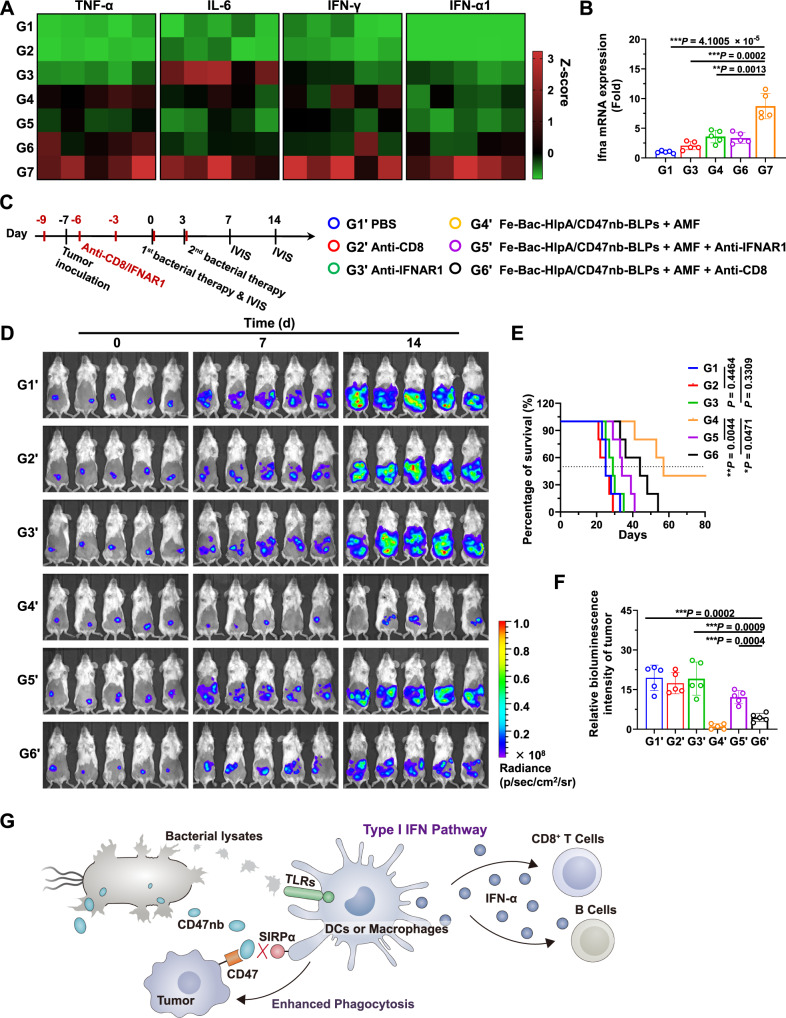
Fig. 7. Activation of type I IFN signaling pathway by AMF-Bac.
A Serum levels of TNF-α, IL-6, IFN-γ, and IFN-α1, as analyzed by ELISA on day 9 in the indicated groups introduced in Fig. 6A (n = 5). Cytokine concentration of each sample was normalized to Z-score (i.e., standard score), which was calculated as (X – E[X])/σ[X]. X, the cytokine concentration of the individual sample; E[X], the average concentration of all samples; σ[X], the standard deviation of cytokine concentrations of all samples. B Ifna mRNA expression levels in tumor-infiltrating DCs, as determined by RT-qPCR on day 9 (n = 5 mice). C Scheme and grouping of in vivo therapy to evaluate the role of the type I IFN signaling pathway and CD8+ T cells. The colons of BALB/c mice were inoculated with CT-26-luc cells on day -7, and the mice were treated with engineered bacteria (1 × 10⁸ CFU) by colon-specific administration on day 0 and day 3, followed by AMF treatment (310 kHz and 23.8 kA/m) for 80 min at 24 h after colon administration. Anti-CD8 (15 mg/kg, clone TIB210) or anti-IFNAR1 (15 mg/kg, clone R46A2) neutralization antibodies were i.p. injected on days −9, −6, −3, 0, and 3. D Bioluminescence imaging was performed to evaluate tumor growth on day 0, 7, and 14 (n = 5). E Survival curves of mice from the indicated groups for 80 days (n = 5 mice). F Semi-quantitative results of bioluminescence intensity in the tumor region on day 14, which were normalized to day 0 (n = 5 mice). G Schematic illustration of the type I IFN pathway and adaptive immunity activated by AMF-Bac. TLRs, Toll-like receptors. The data (B, E, F) are shown as the mean ± SD. Statistical analysis was performed by a two-tailed unpaired t test. Survival significance was analyzed by the log-rank test. *P < 0.05; **P < 0.01; ***P < 0.001. Source data are provided as a Source Data file.

