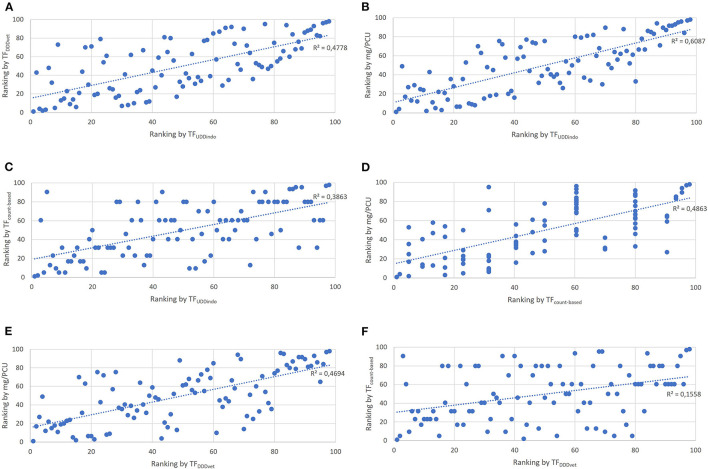
Figure 4.
Scatter plots showing the correlation of individual production cycle AMU rankings between the 4 tested AMU indicators. (A) Correlation between TFDDDvet and TFUDDindo. (B) Correlation between mg/PCU and TFUDDindo. (C) Correlation between TFcount − based and TFUDDindo. (D) Correlation between mg/PCU and TFcount − based. (E) Correlation between mg/PCU and TFDDDvet. (F) Correlation between TFcount − based and TFDDDvet.

