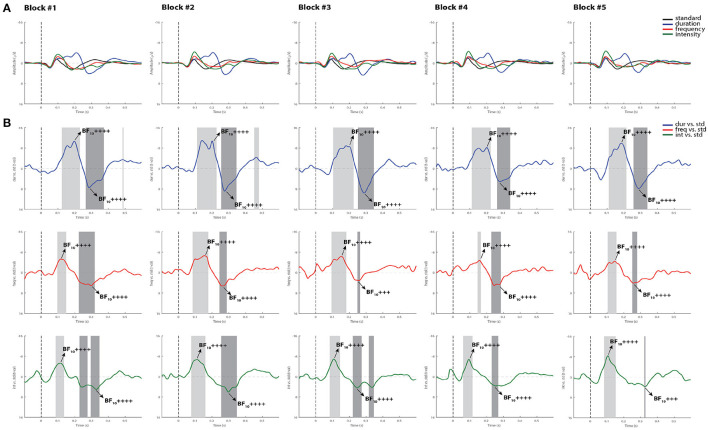
Figure 2.
Grand-average ERPs and statistical findings in healthy controls. (A) Grand-average ERPs across blocks. (B) Time course of the difference between deviants and standard stimuli expressed in units of t-values. Significant intervals for negative components are denoted by a light gray area, and positive components are denoted by a dark gray area. Black arrows show the latency of maximum Bayes factors and the strength of evidence for H1: +, anecdotal; ++, moderate; +++, strong, ++++, very strong to extreme.

