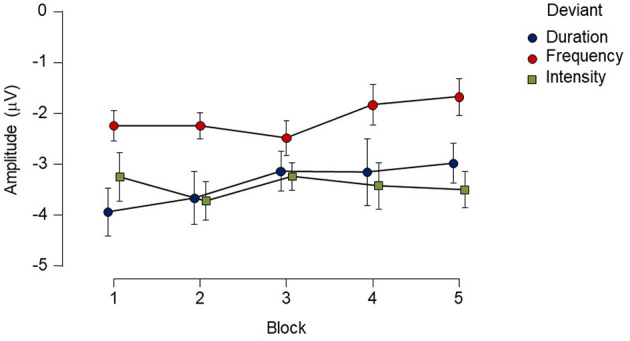
Figure 3.

Mean amplitude and standard errors (SE) of each deviant type for each block recorded over a 12-h period in the healthy control group. While there was main effect of deviant type, no reliable main effect of block or interaction was found. Points represent mean amplitude from each deviant type. Vertical extended lines indicate the standard error intervals.
