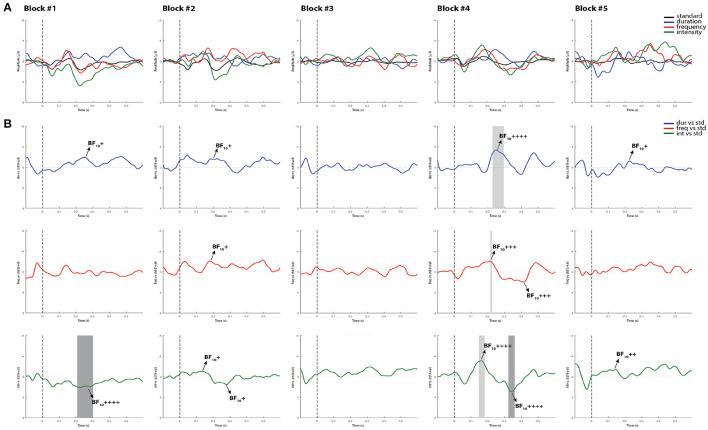
Figure 6.
Individual ERPs and statistical findings of a coma patient (Patient 1) in the first five blocks on day 0. (A) Individual ERPs across blocks. (B) Time course of the difference between deviants and standard stimuli expressed in units of t-values. Significant intervals for negative components are denoted by a light gray area, and those for positive components are denoted by a dark gray area. Black arrows show the latency of maximum Bayes factors and the strength of evidence for H1: +, anecdotal; ++, moderate; +++, strong; ++++, very strong to extreme.

