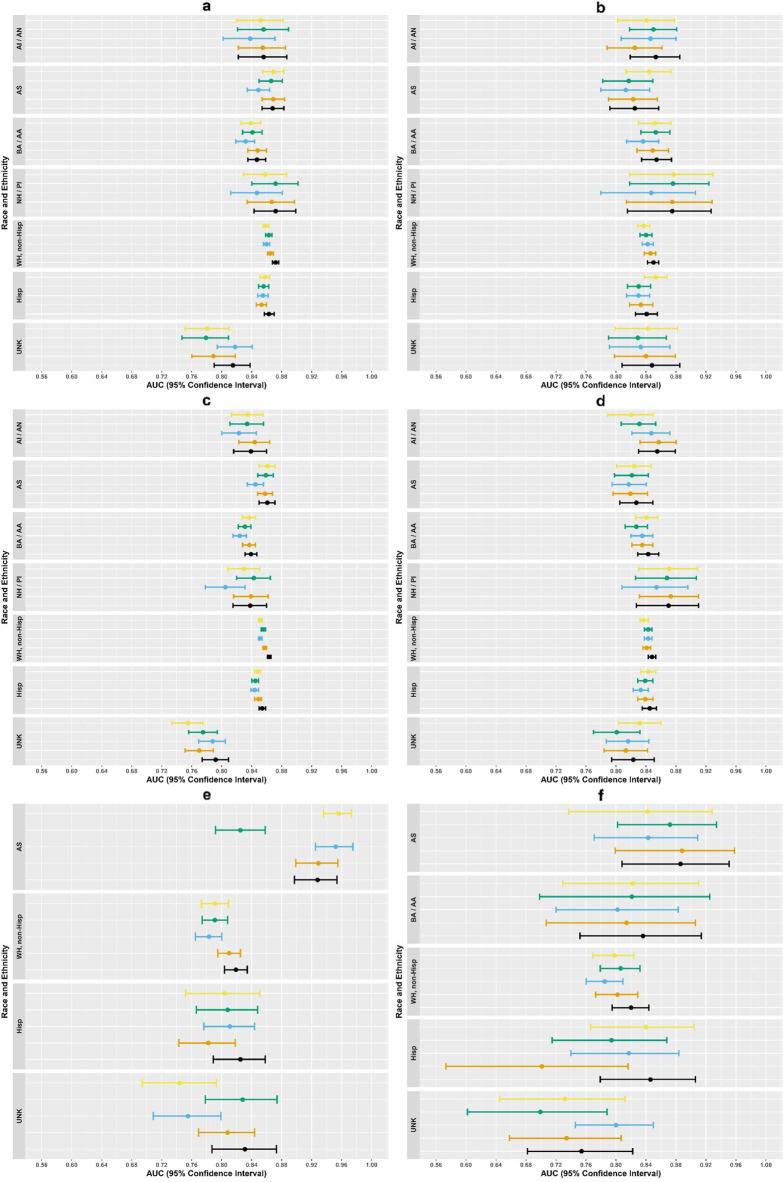
Fig. 3. Variation in area under the receiver operating curve (AUC) across racial and ethnic groups for all suicide risk prediction models.
Each figure panel represents variation in AUC across racial and ethnic groups for different samples, outcomes, and follow-up periods. (a): 30-day suicide attempt prediction models, mental health specialty visits; (b): 30-day suicide attempt prediction models, general medical visits; (c): 90-day suicide attempt prediction models, mental health specialty visits; (d): 90-day suicide attempt prediction models, general medical visits; (e): 90-day suicide prediction models, mental health specialty visits; (f): 90-day suicide prediction models, general medical visits. AI/AN = American Indian/Alaska Native; AS = Asian; BA/AA = Black/African American; NH/PI = Native Hawaiian/Pacific Islander; WH, non-Hisp = white, non-Hispanic; Hisp = Hispanic; UNK = unknown. Original parsimonious (yellow); Logistic regression with lasso variable selection (green); Random forest (blue); Artificial neural network (orange); Ensemble model using logistic regression, random forest, and artificial neural network models with detailed temporal predictors (black). Dots represent AUC in left out validation sample and lines represent upper and lower bounds on 95% confidence intervals based on 10,000 bootstrap samples. Note, due to low number of suicide deaths observed in individuals selecting AI/AN, BA/AA, or NH/PI, confidence intervals for 90-day suicide death were not constructed.

