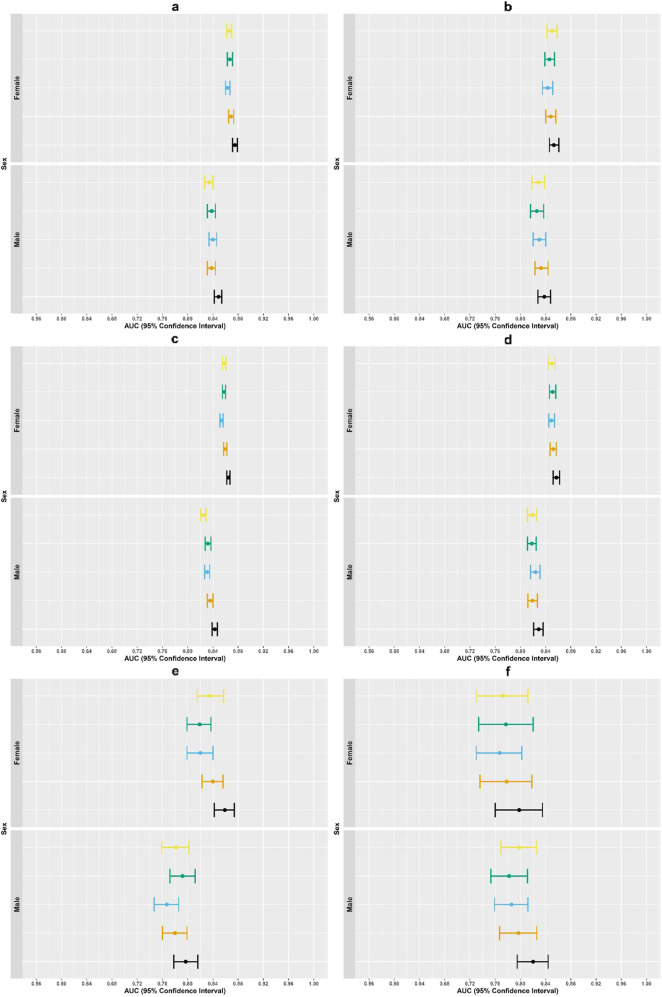
Fig. 4. Variation in area under the receiver operating curve (AUC) across men and women for all suicide risk prediction models.
Dots represent AUC in left out validation sample and the lines represent upper and lower bounds on 95% confidence intervals based on 10,000 bootstrap samples. Each figure panel represents variation in AUC across mend and women for different samples, outcomes, and follow-up periods. (a): 30-day suicide attempt prediction models, mental health specialty visits; (b): 30-day suicide attempt prediction models, general medical visits. (c): 90-day suicide attempt prediction models, mental health specialty visits. (d): 90-day suicide attempt prediction models, general medical visits. (e): 90-day suicide prediction models, mental health specialty visits. (f): 30-day suicide prediction models, general medical visits. Original parsimonious (yellow); Logistic regression with lasso variable selection (green); Random forest (blue); Artificial neural network (orange); Ensemble model using logistic regression, random forest, and artificial neural network models with detailed temporal predictors (black).

